Factor Lab Daily Brief 2026-09-14
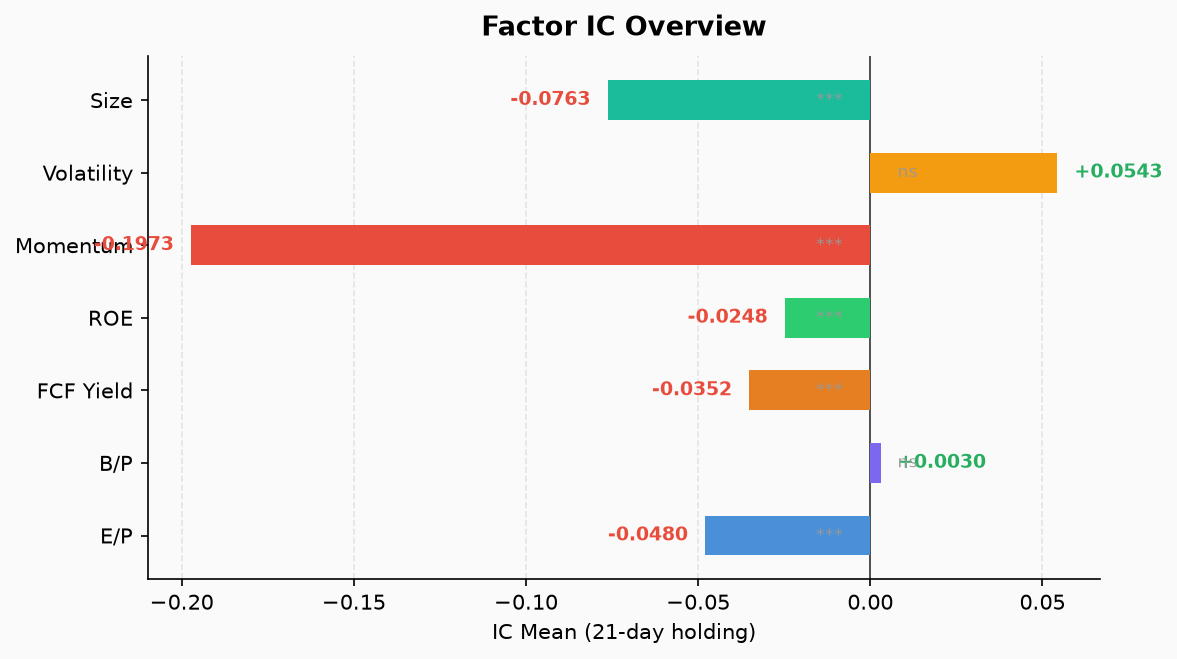
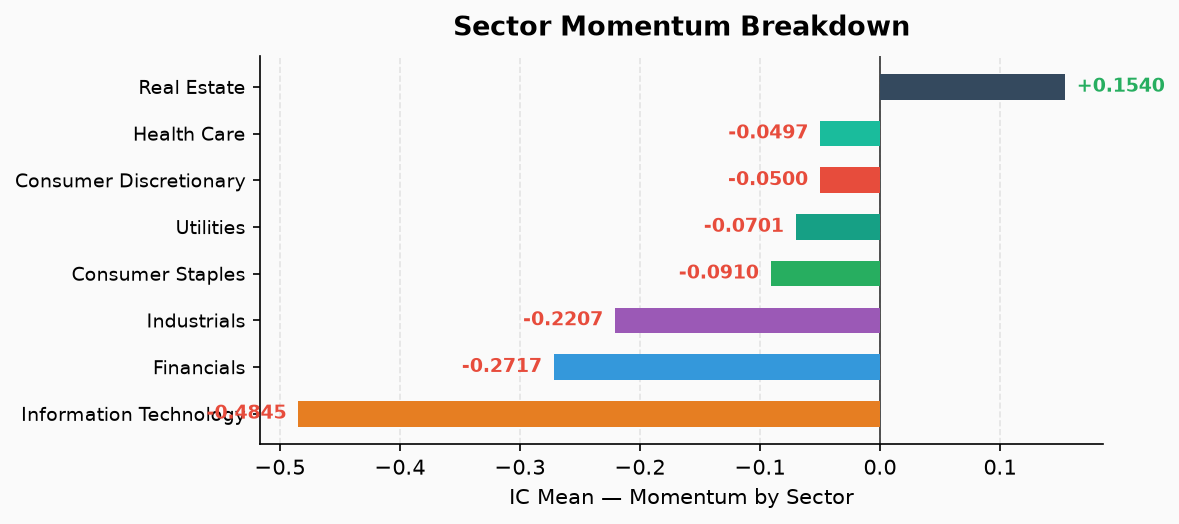
S&P 500 seven-factor cross-sectional test: data through 09-11 (Fri), no new data today. Momentum remains negative (IC=-0.197), value factors EP/FCF Yield/ROE all reversed, SIZE negativity persists. 8 of 8 sectors show momentum regime shift from positive to negative, a continuation of the regime since 08-19.
Factor Lab Daily Brief 2026-09-14
Data Cutoff
2026-09-11 (Friday) — prices_cache.parquet last updated at 06:31 on 09-12, containing daily bars through 09-11. The 09-14 (Monday) run fetched no new market data; all factor values are identical to 09-13.
Universe: S&P 500 constituents, cross-sectional regression test. Factor evaluation window: 21-day forward return. IC is the mean Spearman rank correlation across all historical cross-sections; p-values from ordinary t-test (unadjusted for overlapping samples).
Current State
No new market data; both values persist. The table below shows current vs. prior (09-13) with zero differences.
| Factor | IC | ICIR | p-value | Long-Short (%) | Effective Cross-Sections | Prior IC | Diff |
|---|---|---|---|---|---|---|---|
| MOM | -0.1973 | -1.3819 ⭐ | <0.0001 | +5.99 | 223 | -0.1973 | 0.0000 |
| EP | -0.0480 | -0.5196 ⭐ | 0.0002 | +2.98 | 224 | -0.0480 | 0.0000 |
| BP | +0.0030 | +0.0456 | 0.7276 | +1.13 | 223 | +0.0030 | 0.0000 |
| FCF Yield | -0.0352 | -0.5390 ⭐ | 0.0001 | +2.48 | 223 | -0.0352 | 0.0000 |
| ROE | -0.0248 | -0.6845 ⭐ | <0.0001 | +0.76 | 223 | -0.0248 | 0.0000 |
| VOL | +0.0543 | +0.3283 | 0.0500 | -2.03 | 223 | +0.0543 | 0.0000 |
| SIZE | -0.0763 | -1.0614 ⭐ | <0.0001 | +4.20 | 223 | -0.0763 | 0.0000 |
⭐ = p < 0.05, statistically significant.
Recent Trend (MOM Example, 5 Unique Runs)
| Run Date | IC | ICIR | Diff (vs prior) |
|---|---|---|---|
| 09-09 | -0.2201 | -1.8685 | — |
| 09-10 | -0.2141 | -1.6870 | +0.0060 |
| 09-11 | -0.2037 | -1.4879 | +0.0104 |
| 09-12 | -0.1973 | -1.3819 | +0.0064 |
| 09-14 | -0.1973 | -1.3819 | 0.0000 (no new data) |
MOM turned negative on 08-19 and deepened, hitting -0.43 by 08-29, then moderately recovering to ~-0.20. The 09-09 to 09-14 movement is repeated calculation over the same data window.
Sector Momentum (MOM by Sector)
| Sector | IC | ICIR | Direction |
|---|---|---|---|
| Information Technology | -0.4845 ⭐ | -1.8953 | 🔴 Strong reversal |
| Financials | -0.2717 ⭐ | -1.3066 | 🔴 Strong reversal |
| Industrials | -0.2207 ⭐ | -1.3577 | 🔴 Strong reversal |
| Consumer Staples | -0.0910 | -0.4649 | Negative |
| Utilities | -0.0701 | -0.4711 | Negative |
| Consumer Discretionary | -0.0500 | -0.3171 | Negative |
| Health Care | -0.0497 | -0.1834 | Negative |
| Real Estate | +0.1540 | +0.4716 | Positive (only one) |
Covers 8 GICS sectors. Real Estate is the sole sector with positive momentum, though p=0.054 approaches the insignificance threshold.
Anomaly Alert Interpretation
Today’s anomaly detection flagged 7 “positive-to-negative reversal” alerts (CD, CS, Financials, Industrials, IT, Utilities) and multiple z-score deviation alerts. Cross-referencing ic_history.json confirms: these reversals all began around 08-19, persisting for approximately 4 weeks. Alerts represent continuation of an existing regime, not a Monday突变. The ic_history baseline accumulated大量 positive observations from 05-29 to 08-18 (mean +0.1 to +0.4), causing z-score deviations to keep firing for weeks after the reversal.
Implications for Strategy
- Momentum is in a reversal regime. MOM IC=-0.197 means stocks that led over the prior 21 days underperformed laggards over the next 21 days. This does not predict a market decline—it reflects internal S&P 500 rotation direction.
- Value factors EP/FCF Yield/ROE all negative. High-valuation/low-earnings/low-FCF companies are currently outperforming. This does not signal “value rotation confirmed”—it contradicts traditional value factor expectations.
- SIZE remains negative. Small caps underperforming large caps. SIZE only reflects sample-internal relative size, cannot be extrapolated to broad small-cap trends.
- BP near useless. IC=+0.003, p=0.73; book-value factor provides no discrimination in the current regime.
- VOL at significance edge. p=0.050; low-vol factor barely maintains positive IC, needs monitoring.
Conclusions Not Supported
- ❌ Negative MOM ≠ market must decline tomorrow. IC measures cross-sectional rank-to-return correlation, not directional prediction.
- ❌ Negative sector momentum ≠ all laggards in that sector are buy candidates. Internal sector dispersion remains.
- ❌ Negative EP/FCF Yield ≠ value stocks are due for a bounce. Current negative IC means high-valuation groups still outperform.
- ❌ p < 0.05 ≠ implementable strategy returns. t-test unadjusted for overlapping samples; ICIR is not strategy Sharpe.
- ❌ 6 of 8 sectors “flipped negative” ≠ new risk event today. All are continuations of the regime shift from 08-19.
Statistical & Data Limitations
- IC is historical cross-sectional mean rank correlation, not a single-day IC.
- The default 21-day forward return window means the most recent 21 trading days (08-21 to 09-11) may not be fully evaluable if factor values updated as late as 09-09.
- p-values from ordinary t-test, unadjusted for autocorrelation in overlapping returns.
- Sector decomposition covers only 8 GICS sectors within S&P 500, excluding non-constituent equities.
- Data through 09-11; 09-14 has no incremental data. Next market update requires 09-15 (Monday) market close.