Factor Lab Daily Brief 2026-09-13
S&P 500 seven-factor cross-sectional test: data through 09-11 (Fri), no new weekend data. Momentum factor broadly reversed (IT IC=-0.48), SIZE remains significantly negative, BP essentially无效. Both-state continuation, not a new regime shift.
Factor Lab Daily Brief 2026-09-13
Data As-Of: 2026-09-11 (Thursday)
The prices_cache.parquet ends on 2026-09-11 (Thursday close). Today is Sunday 09-13, a weekend with no new trading data. This run’s results are identical to 09-12 (Friday) — no data update, no state change.
Sample & Evaluation Methodology
- Universe: S&P 500 constituents
- Fundamental data: Rolling TTM financial panel; valid stocks for EP/BP/FCF Yield/ROE = 502/502/502/474
- Price data: Daily adjusted close; valid for MOM/VOL/SIZE = 502 stocks
- Evaluation window: 60 cross-sectional observations (fundamental factors); 39 cross-sections (price factors, due to 21-day forward + 273-day lookback lag; the most recent 21 trading days cannot be fully evaluated)
- IC: Spearman rank correlation between factor value and next-period return (average across historical cross-sections), not daily IC
- Long-Short: Q1 long − Q5 short
Seven-Factor Summary
| Factor | IC | ICIR | p-value | Previous IC | Delta | Cross-Sections |
|---|---|---|---|---|---|---|
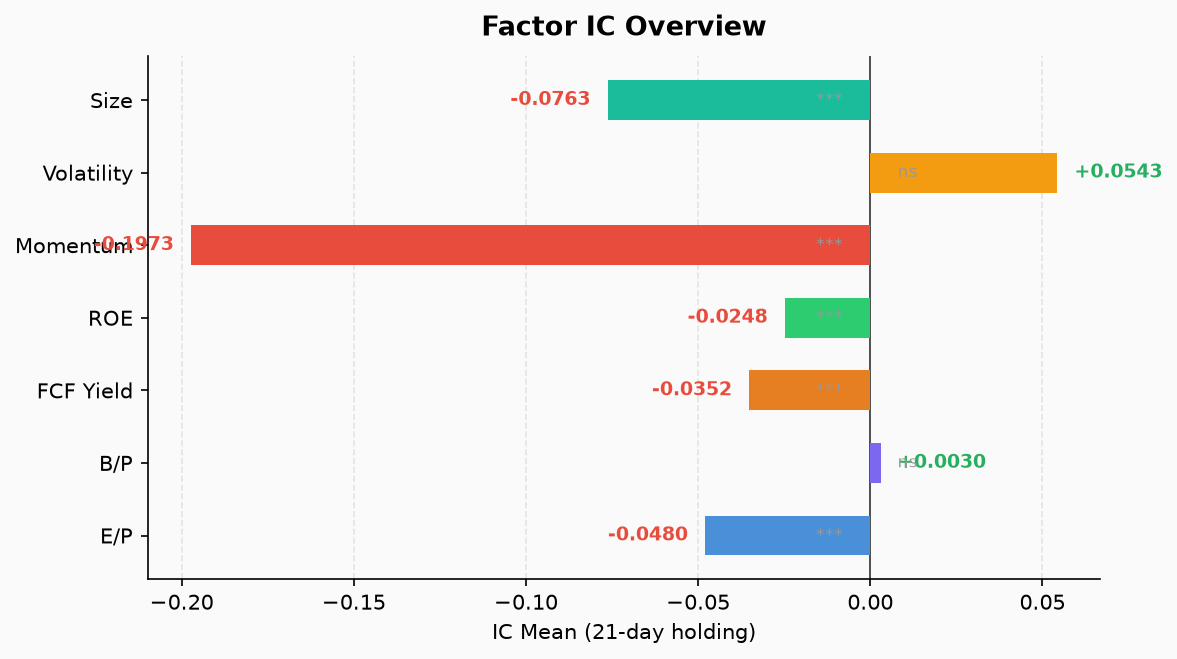
| EP | −0.0480 | −0.52 | 0.0002 | −0.0480 | 0.0000 | 60 |
| BP | +0.0030 | +0.05 | 0.7276 | +0.0030 | 0.0000 | 60 |
| FCF Yield | −0.0352 | −0.54 | 0.0001 | −0.0352 | 0.0000 | 60 |
| ROE | −0.0248 | −0.68 | 0.0000 | −0.0248 | 0.0000 | 60 |
| MOM | −0.1973 | −1.38 | 0.0000 | −0.1973 | 0.0000 | 39 |
| VOL | +0.0543 | +0.33 | 0.0500 | +0.0543 | 0.0000 | 39 |
| SIZE | −0.0763 | −1.06 | 0.0000 | −0.0763 | 0.0000 | 39 |
Previous values from:
analyses/factor_lab/factor_test_20260912_0631.json, identical to current.
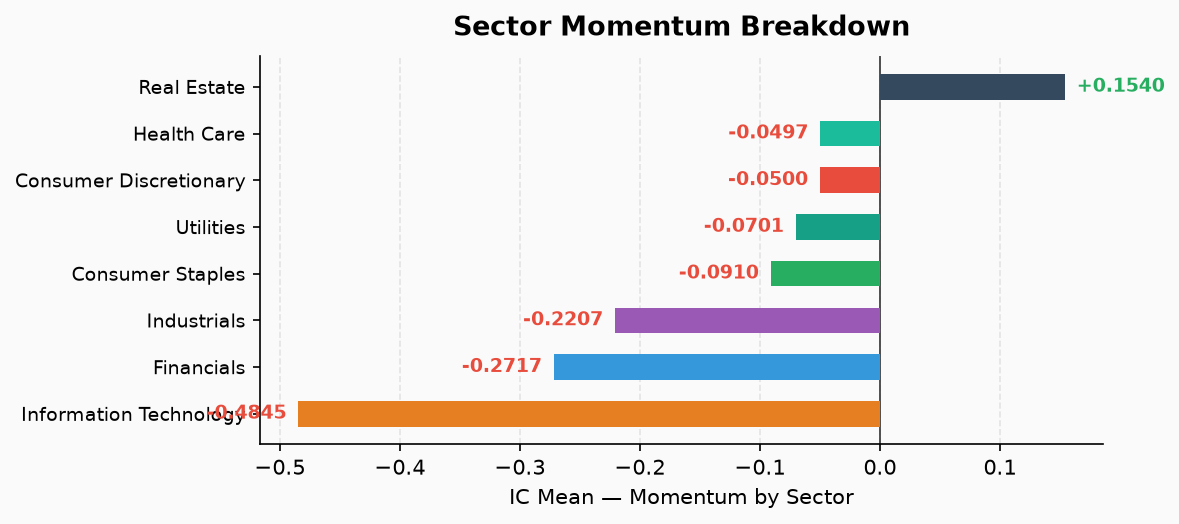
Sector Momentum (MOM by Sector)
| Sector | IC | ICIR | Direction |
|---|---|---|---|
| Information Technology | −0.4845 | −1.90 | 🔴 Strong reversal |
| Financials | −0.2717 | −1.31 | 🔴 Strong reversal |
| Industrials | −0.2207 | −1.36 | 🔴 Strong reversal |
| Consumer Staples | −0.0910 | −0.46 | Negative |
| Utilities | −0.0701 | −0.47 | Negative |
| Consumer Discretionary | −0.0500 | −0.32 | Negative |
| Health Care | −0.0497 | −0.18 | Insignificant |
| Real Estate | +0.1540 | +0.47 | Positive (edge-significant) |
Factor IC Time Series
Implications & Non-Inferences
What we can observe
- Broad momentum reversal: 7/8 sectors show negative MOM IC, with IT at −0.48 deepest. This regime has persisted ~4-5 weeks since the late-August shift — not a new Friday/Sunday development.
- SIZE remains significantly negative (IC=−0.08): Smaller caps outperformed larger caps within this sample period.
- EP/FCF Yield/ROE all negative: High valuation (low EP), low FCF Yield, and high ROE stocks underperformed subsequently in cross-section.
- BP essentially无效: IC=0.003, p=0.73.
- VOL marginally positive (p=0.050), at the edge of significance.
What we cannot conclude
- Negative MOM does not imply a market-wide decline
- Negative SIZE does not signal a broad small-cap rally
- p-values are uncorrected for overlapping returns; cannot claim “highly significant, not random”
- Anomaly alerts (🔴 positive-to-negative flip) reflect regime continuation per
ic_historybaseline, not a daily shock
Statistical & Data Limitations
- Data as-of 09-11; today’s run reuses identical data
- Only 39 valid cross-sections for price factors; the most recent 21 days are unevaluable
- IC is a historical cross-sectional average rank correlation, not a daily IC or forward return prediction
- t-tests do not account for overlapping return autocorrelation
ic_historybaseline contains many duplicate entries (same-date duplicates), z-scores are approximate
Data source: yfinance daily prices + TTM financial panel, S&P 500 constituents. This report is a factor research record and does not constitute investment advice.