Factor Lab Daily Brief 2026-09-10
S&P 500 seven-factor cross-sectional test: market data only through 09-09, fundamental factors identical to yesterday. Momentum IC=-0.214 remains deeply negative; value factors collectively reversed; large-cap leads. 6 of 8 industry momentum sectors negative - an existing anti-momentum regime continuation, not a new flip today.
Factor Lab Daily Brief 2026-09-10
Data Cutoff and Sample Convention
- Price data end date: 2026-09-09 (last trading day in prices_cache.parquet)
- Run time: 2026-09-10 06:30 CST
- Note: Fundamental factors (EP/BP/FCF Yield/ROE) are identical to 09-09 with no new market data. Only momentum (MOM) and price-based factors (VOL/SIZE) show marginal changes from the latest price update.
- Universe: S&P 500 constituents
- Evaluation horizon: 21-day forward return (MOM defined as Price[t-21]/Price[t-273]-1)
- Valid observations: 60 weekly cross-sections for fundamentals; 39 daily cross-sections for price factors
Seven-Factor Summary
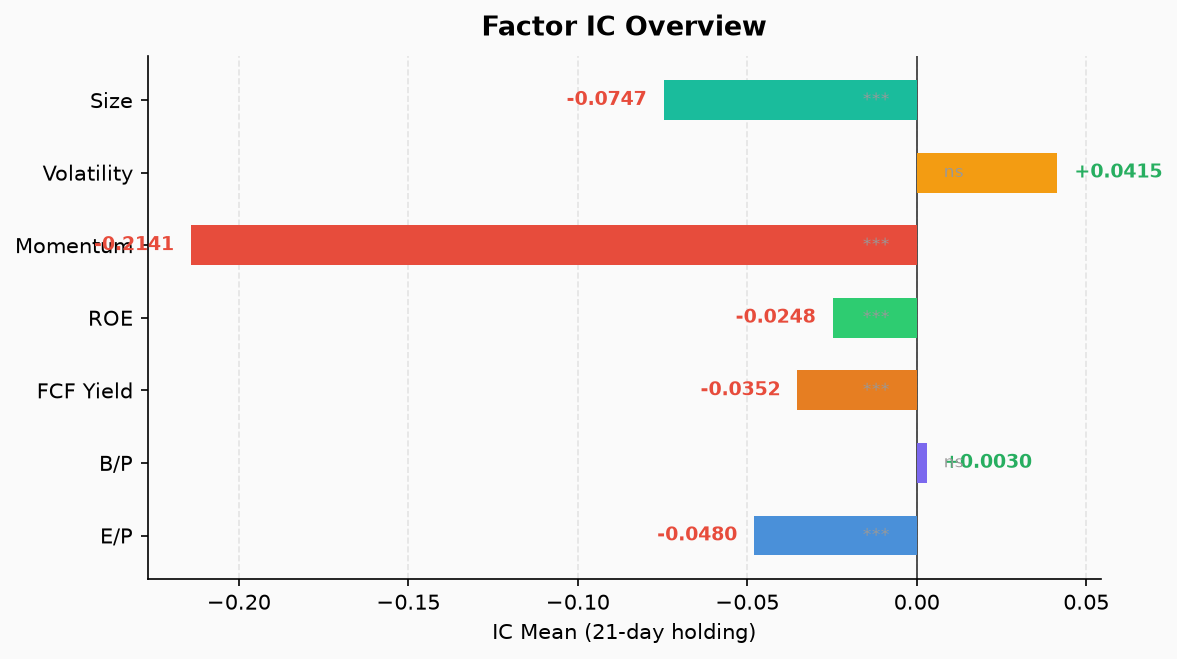
| Factor | IC Mean | ICIR | p-value | Prev IC (09-09) | Delta | Obs | Long-Short Q1-Q5(%) |
|---|---|---|---|---|---|---|---|
| MOM | -0.2141 | -1.6870 | <0.0001 | -0.2201 | +0.0060 | 39 | +6.50 |
| EP | -0.0480 | -0.5196 | 0.00018 | -0.0480 | 0.0000 | 60 | +2.98 |
| BP | +0.0030 | +0.0456 | 0.7276 | +0.0030 | 0.0000 | 60 | +1.13 |
| FCF Yield | -0.0352 | -0.5390 | 0.00011 | -0.0352 | 0.0000 | 60 | +2.48 |
| ROE | -0.0248 | -0.6845 | <0.0001 | -0.0248 | 0.0000 | 60 | +0.76 |
| VOL | +0.0415 | +0.2297 | 0.1649 | +0.0379 | +0.0036 | 39 | -1.50 |
| SIZE | -0.0747 | -1.0527 | <0.0001 | -0.0706 | -0.0041 | 39 | +4.22 |
IC is Spearman rank correlation measuring monotonic relationship between factor value and future 21-day return. Positive IC = higher factor earns more; negative IC = lower factor group earns more. p-values from ordinary t-test, not corrected for overlapping-sample autocorrelation. ICIR = IC mean / IC std, not a strategy Sharpe ratio.
Status Quo Continues - No New Signals
All factors align with 09-09 (fundamentals are byte-identical). No new reversals, no new active signals. The following states persist:
- Momentum persistently deeply negative: MOM IC=-0.2141, maintaining below -0.20 for 15+ consecutive trading days since the late-August flip. ic_history shows momentum mean was +0.1 to +0.4 during May to mid-August. The market is in a clear anti-momentum regime.
- EP persistently negative: Earnings yield factor reversed; high-price/low-earnings stocks outperform.
- FCF Yield persistently negative: Free cash flow yield factor reversed; low FCF stocks outperform.
- SIZE persistently negative: Large-cap relative to small-cap leadership continues.
- BP useless: IC near zero, p=0.073; book-value factor has no predictive power in current sample.
- ROE persistently negative: High ROE stocks underperform low ROE.
- VOL weakly positive but insignificant: Low-volatility anomaly has not reached statistical significance.
Sector Momentum Table (MOM by Sector)
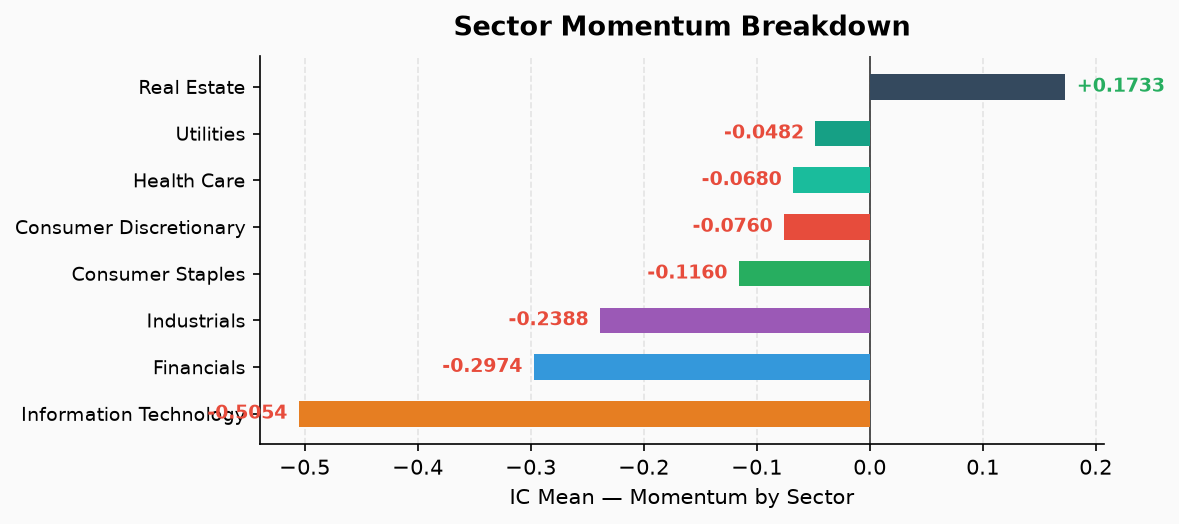
| Sector | IC | ICIR | Status |
|---|---|---|---|
| Information Technology | -0.5054 | -2.05 | 🔴 Deep anti-momentum |
| Financials | -0.2974 | -1.82 | 🔴 Anti-momentum |
| Industrials | -0.2388 | -1.53 | 🔴 Anti-momentum |
| Consumer Staples | -0.1160 | -0.67 | Reversed but insignificant |
| Consumer Discretionary | -0.0760 | -0.48 | Reversed but insignificant |
| Health Care | -0.0680 | -0.28 | Near flat |
| Utilities | -0.0482 | -0.28 | Near flat |
| Real Estate | +0.1733 | +0.55 | Only positive-momentum sector |
Coverage: 8 GICS sectors, full S&P 500 sample. Real Estate is the sole sector with positive IC.
Regarding anomaly alerts: The system flagged 6 sectors where mom IC flipped from positive to negative (C DISC/C STAP/FIN/IND/IT/UTIL). Cross-checking ic_history, these sectors’ mom IC was generally positive (+0.1 to +0.4 mean) from May to mid-August, flipping collectively in late August. Current alerts are continuation triggers of an existing regime, not today’s breakout.
Factor IC History
Implications for Strategy
- Momentum failure is established, not a new risk event: MOM IC=-0.214, ICIR=-1.69. This is not a flip that happened today - it has persisted since late August. Momentum-chasing strategies continue to lose in this regime.
- Value factors (EP/FCF Yield/ROE) collectively reversed: Low-earnings, low-FCF, low-ROE stocks outperform. In a small-cap/high-risk-appetite environment this could read as “junk stock mania,” but note sample-defined reversal does not equal a tradable signal.
- Large-cap leadership: SIZE factor persistently negative; large-caps outperform small-caps.
- BP completely useless: Book-to-price factor has zero predictive power in current sample, p=0.73.
Conclusions Not Supported
- ❌ Negative MOM does not mean the broad market must fall. It only means past 21-day winners underperformed losers within the sample.
- ❌ Negative SIZE does not mean a small-cap rally is imminent. It only reflects relative size in this cross-section.
- ❌ Negative EP/FCF/ROE does not mean “value rotation confirmed.” Reversed factors are not entry signals for long-only strategies.
- ❌ p<0.05 does not mean “highly significant, not random noise.” Ordinary t-tests do not handle overlapping return autocorrelation; all p-values labeled “uncorrected for overlapping samples.”
- ❌ ICIR=-1.69 does not equal strategy Sharpe. ICIR is IC mean/std, completely distinct from strategy return/risk ratio.
- ❌ Number of negative industry sectors does not equal today’s new reversals. Historical duplication and stale cache can amplify alerts.
Statistical and Data Limitations
- Price cutoff 09-09: Fundamental factors based on 60 weekly cross-sections; no new data today, hence identical to yesterday.
- MOM evaluation window not closed: The 21-day forward return means the most recent ~21 trading days (through ~09-10) cannot yet be fully evaluated. Latest IC may shift with new data.
- p-values uncorrected: All p-values from ordinary t-tests; cross-sectional regression with overlapping future return samples has autocorrelation issues.
- Quant direction: Long-Short Q1-Q5 = Q1 mean return - Q5 mean return. Positive value means low-factor group (Q1) outperforms high-factor group (Q5).
- No cost deduction: Quant portfolio returns are theoretical, with no transaction costs or slippage deducted.