Factor Lab Daily Report 2026-08-18
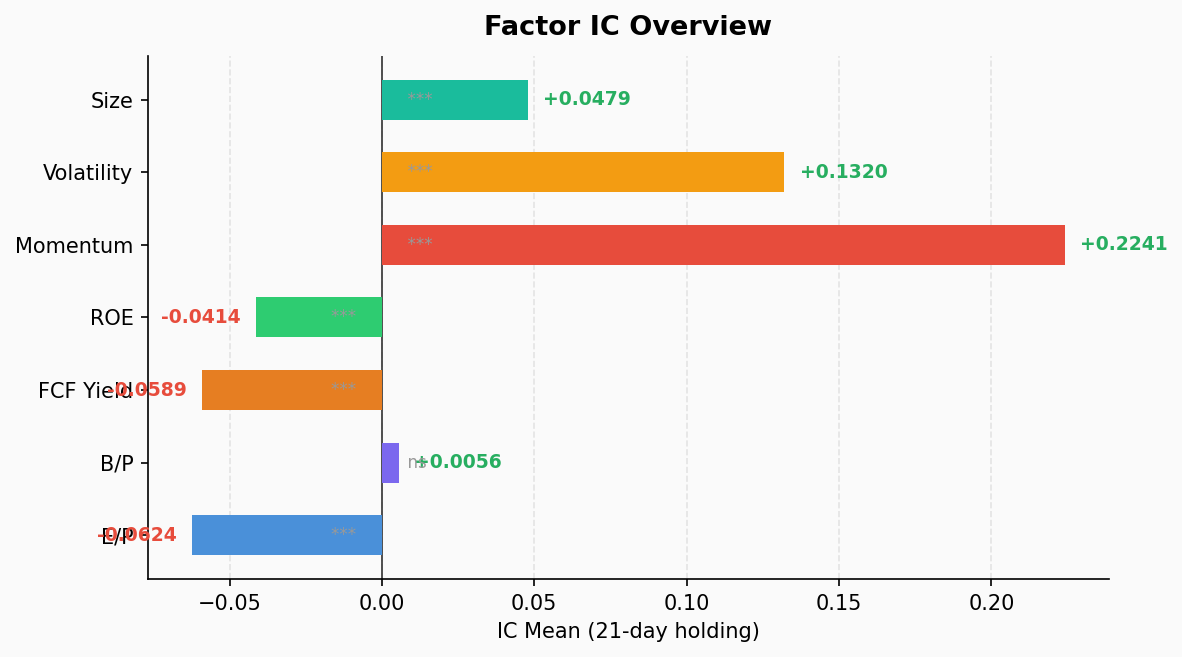
Momentum factor remains dominant (ICIR 2.70) with IT sector momentum IC at 0.52; value factors entirely broken with significant negative IC for EP/FCF Yield; Volatility factor shows positive IC of 0.13, high-risk-high-return regime persists; Health Care is the only sector with momentum reversal.
Full Factor IC Test (21-Day Holding Period)
| Factor | IC Mean | ICIR | t-Stat | p-Value | IC Positive % | Long-Short Return % (Q1-Q5) |
|---|---|---|---|---|---|---|
| EP | -0.062 | -0.74 | -4.57 | 0.00005 | 17.9% | +3.87% |
| BP | +0.006 | +0.08 | +0.48 | 0.635 | 46.2% | +0.82% |
| FCF Yield | -0.059 | -1.43 | -8.79 | 0.000 | 7.7% | +3.04% |
| ROE | -0.041 | -1.23 | -7.58 | 0.000 | 12.8% | +1.11% |
| Mom | +0.224 | +2.70 | +16.62 | 0.000 | 100% | -8.07% |
| Vol | +0.132 | +1.05 | +6.48 | 0.000 | 79.5% | -7.61% |
| Size | +0.048 | +1.25 | +7.70 | 0.000 | 87.2% | -2.06% |
Key Observations:
- Momentum factor continues to lead: IC mean 0.224, ICIR 2.70, with 100% of 39 IC observations positive. Q5 (high momentum) average return 7.95% vs Q1 (low momentum) at -0.12%, an 8.07% long-short spread. The most reliable alpha source currently.
- Value factors entirely broken: EP (ICIR -0.74), FCF Yield (ICIR -1.43), and ROE (ICIR -1.23) all show significant negative IC. Low-valuation/high-ROE stocks are underperforming while high-valuation/low-ROE stocks outperform — a classic growth-favorable regime.
- BP essentially useless: ICIR of only 0.08, p-value 0.64, book-to-price has no discriminative power for returns.
- Volatility factor positive: ICIR 1.05, high-volatility stocks generate higher returns, indicating the market is chasing risk rather than playing defense.
- Size factor mildly positive: ICIR 1.25, large caps slightly outperform small caps, but the effect is modest.
Sector Momentum Breakdown
| Sector | # Stocks | IC Mean | ICIR | IC Positive % | Long-Short Return % (Q1-Q5) |
|---|---|---|---|---|---|
| Information Technology | 73 | +0.524 | +2.58 | 100% | -28.54% |
| Financials | 76 | +0.309 | +2.63 | 100% | -7.19% |
| Industrials | 79 | +0.266 | +2.88 | 100% | -7.14% |
| Consumer Discretionary | 48 | +0.252 | +2.11 | 100% | -6.21% |
| Consumer Staples | 36 | +0.209 | +1.34 | 87.2% | -4.67% |
| Utilities | 31 | +0.199 | +1.01 | 76.9% | -0.63% |
| Real Estate | 31 | +0.124 | +0.84 | 74.4% | -3.83% |
| Health Care | 59 | -0.128 | -1.21 | 15.4% | +7.51% |
Sector Highlights:
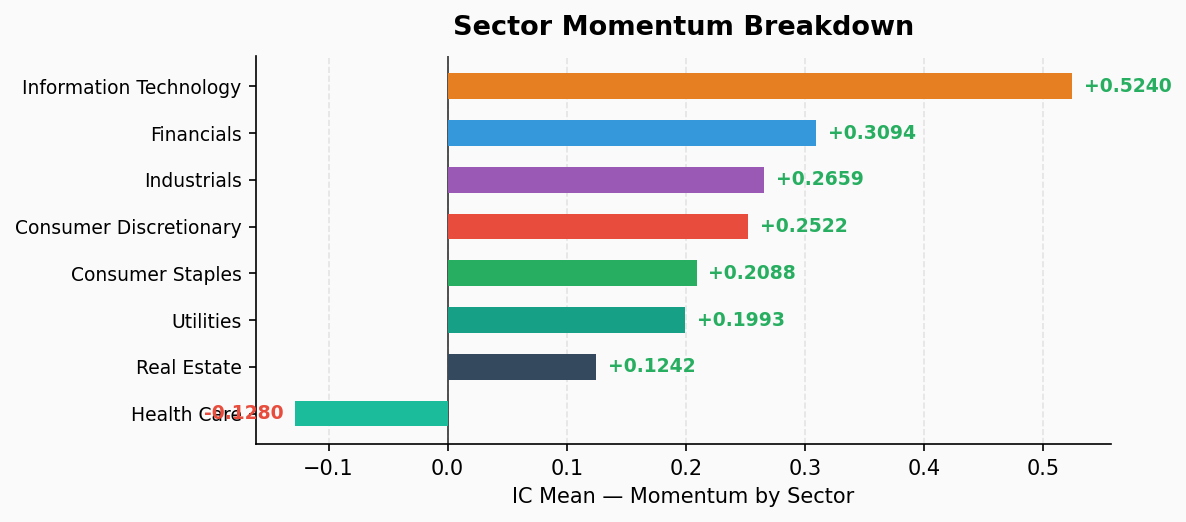
- IT momentum is extreme: Sector momentum IC of 0.524, ICIR 2.58. Q5 average return 27.19% vs Q1 at -1.35%, a 28.54% long-short spread. This is the strongest sector momentum signal across the board — extreme divergence within tech, winners take all.
- Financials/Industrials close behind: ICIRs of 2.63 and 2.88 respectively, momentum effect equally highly significant. Financials Q5 return 7.80%, Industrials Q5 return 5.51%.
- Health Care is the sole reversal sector: IC -0.128, ICIR -1.21, IC positive rate only 15.4%. Momentum reversal is pronounced within healthcare — former leaders are underperforming, with Q1 return 4.84% far exceeding Q5 at -2.66%. Watch for mean-reversion pressure in health care.
- Utilities momentum weak: ICIR 1.01, long-short spread only 0.63%, momentum has almost no discriminative power in utilities.
- Consumer Staples moderate: ICIR 1.34, momentum still effective but weaker than Consumer Discretionary (2.11), momentum effect attenuating in defensive sectors.
Summary
The market is in a clear growth/momentum-driven regime. Momentum factor performance is extreme in IT, Financials, and Industrials — all with ICIR above 2.1, with IT reaching extreme levels. Value factors (EP/BP/FCF/ROE) are entirely broken or even inverted, signaling the market is not rewarding “cheap” or “high quality” stocks for now.
Risk signals to watch:
- IT momentum IC of 0.524 is an extreme outlier — historically, ICs above 0.4 often precede reversal episodes
- Health Care already showing reversal patterns, which could be a leading indicator for other momentum-heavy sectors
- Positive volatility factor (high vol = high return) indicates elevated risk appetite; if sentiment turns, the drawdown could be sharp
Strategy implications: Momentum remains the dominant theme, but concentration risk in IT warrants attention. Consider sector rotation or a momentum + defensive factor combination to hedge extreme positioning.