Factor Lab Daily Report 2026-08-14
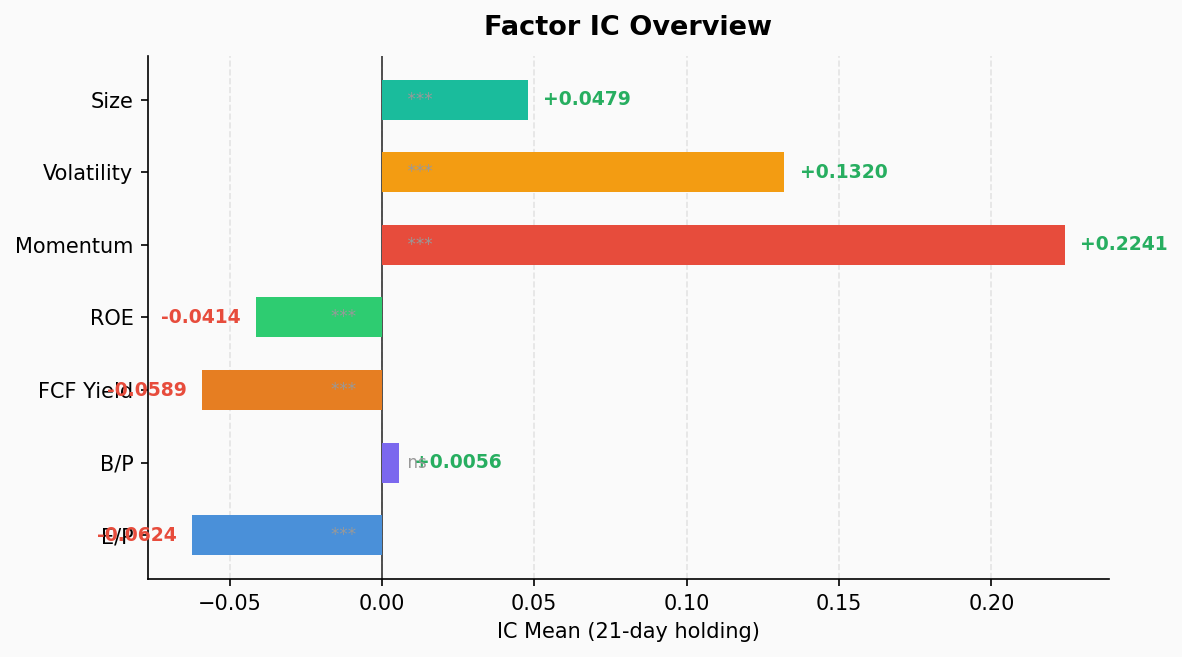
Momentum factor continues to dominate with ICIR 2.70, leading all factors. Value factors (EP/FCF Yield) remain weak with negative ICs. IT sector shows strongest momentum (IC 0.524), while Health Care exhibits reversal patterns. Risk-on environment with high-volatility stocks outperforming.
Factor IC Tests
Test window: 21-day holding period, 39 IC observations, 503 stocks (475 for ROE)
| Factor | IC Mean | ICIR | t-stat | p-value | IC Positive % | Long-Short (Q1-Q5) |
|---|---|---|---|---|---|---|
| Momentum | 0.224 | 2.70 | 16.62 | 0.000 | 100% | -8.07% |
| Volatility | 0.132 | 1.05 | 6.48 | 0.000 | 79.5% | -7.61% |
| Size | 0.048 | 1.25 | 7.70 | 0.000 | 87.2% | -2.06% |
| B/P | 0.006 | 0.08 | 0.48 | 0.635 | 46.2% | 0.82% |
| ROE | -0.041 | -1.23 | -7.58 | 0.000 | 12.8% | 1.11% |
| FCF Yield | -0.059 | -1.43 | -8.79 | 0.000 | 7.7% | 3.04% |
| E/P | -0.062 | -0.74 | -4.57 | 0.000 | 17.9% | 3.87% |
Key Findings:
- Momentum dominates decisively: IC 0.224, ICIR 2.70, with 100% positive IC days across 39 observations — an exceptionally strong unidirectional signal. Q5 (strong momentum) returned 7.95% vs Q1 (weak momentum) at -0.12%, an 8.07% spread
- Value factors completely broken: EP (IC -0.062) and FCF Yield (IC -0.059) are significantly negative — expensive stocks continue to outperform cheap ones. B/P is essentially zero (IC 0.006), book value has no explanatory power
- Quality factor weakening: ROE IC -0.041, high-ROE stocks underperforming, suggesting the market prioritizes price trends over earnings quality
- High volatility = high returns: Volatility IC 0.132, ICIR 1.05, high-beta stocks clearly outperforming (Q5 return 8.15% vs Q1 0.54%), confirming a risk-on environment
- Large caps slightly ahead: Size IC 0.048, ICIR 1.25, large-cap stocks modestly outperforming small-caps
Sector Momentum Breakdown
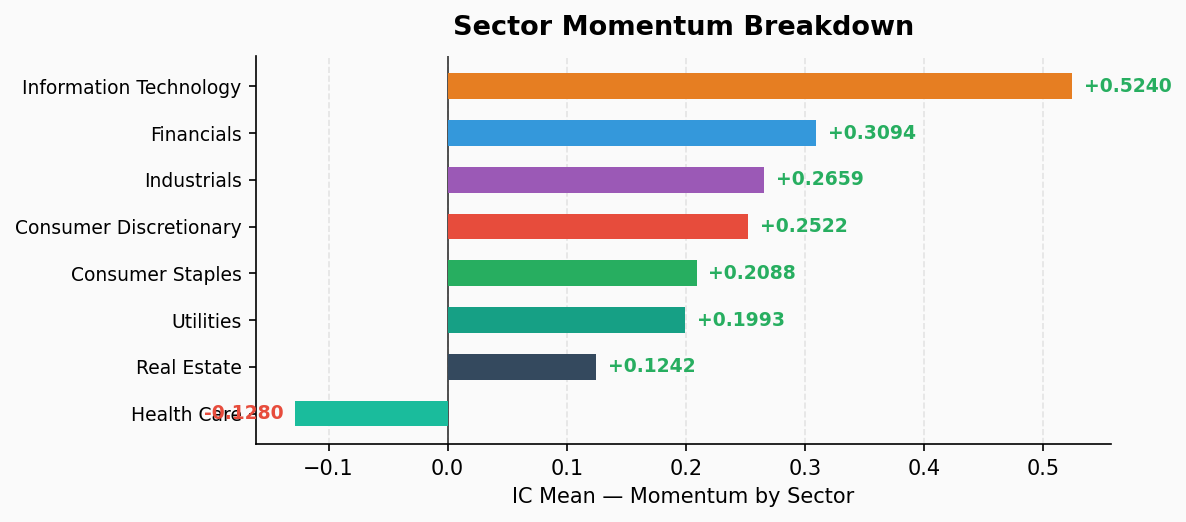
Momentum factor decomposed by GICS sector (based on 08/13 data, 21-day holding period):
| Sector | Stocks | IC Mean | ICIR | t-stat | IC Positive % | Q5-Q1 Return |
|---|---|---|---|---|---|---|
| Information Technology | 73 | 0.524 | 2.58 | 15.93 | 100% | 28.54% |
| Financials | 76 | 0.309 | 2.63 | 16.19 | 100% | 7.19% |
| Industrials | 79 | 0.266 | 2.88 | 17.74 | 100% | 7.14% |
| Consumer Discretionary | 48 | 0.252 | 2.11 | 13.01 | 100% | 6.21% |
| Consumer Staples | 36 | 0.209 | 1.34 | 8.27 | 87.2% | 4.67% |
| Utilities | 31 | 0.199 | 1.01 | 6.20 | 76.9% | 0.63% |
| Real Estate | 31 | 0.124 | 0.84 | 5.18 | 74.4% | 3.83% |
| Health Care | 59 | -0.128 | -1.21 | -7.43 | 15.4% | -7.51% |
Sector Highlights:
- IT momentum is extreme: IC 0.524 is the highest across all sectors. Q5 returned 27.19% vs Q1 at -1.35%, a 28.54% spread. Tech’s momentum effect dwarfs every other sector
- Financials and Industrials follow strongly: Financials IC 0.309, Industrials IC 0.266, both with ICIR above 2.6 — very robust momentum signals
- Health Care shows reversal: The only sector with negative momentum IC (-0.128). Q1 returned 4.84% vs Q5 at -2.66%, indicating that chasing winners in Health Care actually loses money
- Utilities momentum weakest: IC 0.199 but ICIR only 1.01, Q5-Q1 spread of just 0.63% — momentum is largely ineffective here
- Consumer Staples steady: IC 0.209, ICIR 1.34, momentum works but with moderate intensity, consistent with the defensive nature of the sector
Summary
The market is in a classic trend-following + risk-on regime:
- Momentum is the only real alpha source: ICIR 2.70 with 100% positive IC rate — trend-following strategies remain highly effective in the current environment
- Value factors are comprehensively broken: EP, FCF Yield, and B/P show no positive returns — the market is completely ignoring valuation
- Sector dispersion is extreme: IT momentum IC 0.524 vs Health Care -0.128 — sector selection matters more than factor selection
- Risk appetite is clear: High-volatility outperformance and large-cap outperformance confirm capital is flowing toward certainty and popular names
- Health Care warrants contrarian attention: The only sector showing momentum reversal, potentially signaling a bottoming process worth monitoring for reversal entry points