Factor Lab Daily Report 2026-08-13
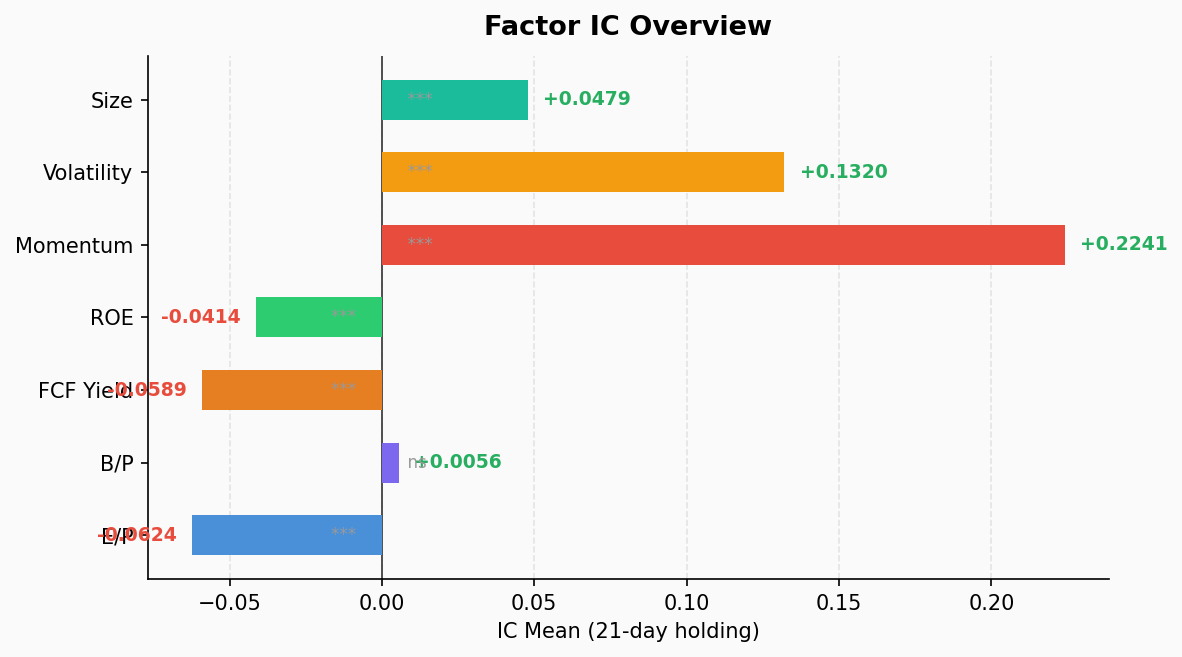
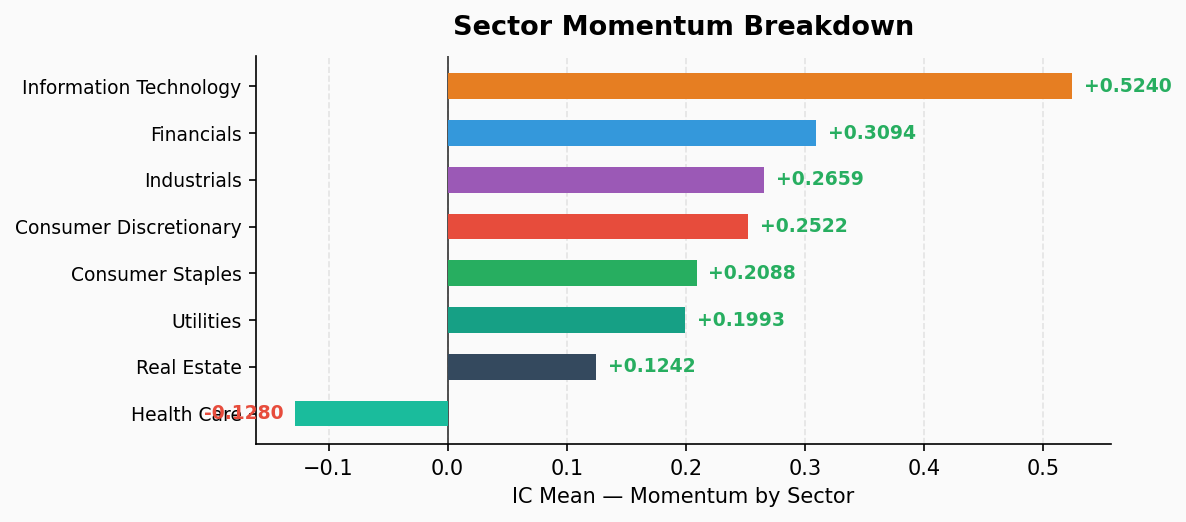
2026-08-13 Factor overview: Momentum factor remains dominant (ICIR 2.70), Volatility factor recovering (ICIR 1.05). Value factors show internal divergence — EP reversal significant (ICIR -0.74), FCF Yield reversal stronger (ICIR -1.43). By sector, Tech momentum IC reaches 0.52, followed by Financials and Industrials; Healthcare shows momentum reversal.
Factor IC Tests
Based on S&P 500 constituents, 21-day holding period Rank IC results:
| Factor | IC Mean | ICIR | t-stat | p-value | IC Positive % | Long-Short (Q1-Q5) |
|---|---|---|---|---|---|---|
| EP (Earnings Yield) | -0.062 | -0.74 | -4.57 | <0.001 | 17.9% | +3.87% |
| BP (Book Yield) | +0.006 | +0.08 | +0.48 | 0.635 | 46.2% | +0.82% |
| FCF Yield | -0.059 | -1.43 | -8.79 | <0.001 | 7.7% | +3.04% |
| ROE | -0.041 | -1.23 | -7.58 | <0.001 | 12.8% | +1.11% |
| Momentum | +0.224 | +2.70 | +16.62 | <0.001 | 100% | -8.07% |
| Volatility | +0.132 | +1.05 | +6.48 | <0.001 | 79.5% | -7.61% |
| Size | +0.048 | +1.25 | +7.70 | <0.001 | 87.2% | -2.06% |
Key Observations:
Momentum factor dominates: IC mean 0.224, ICIR 2.70, IC positive rate 100% — momentum has contributed positively on every single day over the past 39 trading days. Q5 (strongest momentum) averaged 7.95% returns vs Q1’s -0.12%, an 8.07% long-short spread. Trend-following remains the market’s main theme.
Value factors in full reversal: EP (ICIR -0.74) and FCF Yield (ICIR -1.43) show significant negative IC, meaning high-valuation stocks are outperforming low-valuation ones. This aligns with strong momentum — the market is chasing growth and momentum, not value or margin of safety.
Volatility factor positive: ICIR 1.05, high-volatility stocks outperforming (Q5 return 8.15% vs Q1’s 0.54%), risk appetite recovering.
Quality factor weakening: ROE ICIR -1.23, high-ROE stocks underperforming low-ROE stocks. The market is not rewarding quality.
Size factor mildly positive: ICIR 1.25, large-cap slight edge but not significant.
BP essentially dead: ICIR 0.08, p-value 0.635, book-to-price ratio has no stock-selection power.
Sector Momentum Breakdown
Momentum factor performance by GICS sector (based on 8/12 data):
| Sector | Sample | IC Mean | ICIR | IC Positive % | Q5-Q1 Spread |
|---|---|---|---|---|---|
| Information Tech | 73 | +0.524 | +2.58 | 100% | -28.54% |
| Financials | 76 | +0.309 | +2.63 | 100% | -7.19% |
| Industrials | 79 | +0.266 | +2.88 | 100% | -7.14% |
| Consumer Disc. | 48 | +0.252 | +2.11 | 100% | -6.21% |
| Consumer Staples | 36 | +0.209 | +1.34 | 87.2% | -4.67% |
| Utilities | 31 | +0.199 | +1.01 | 76.9% | -0.63% |
| Real Estate | 31 | +0.124 | +0.84 | 74.4% | -3.83% |
| Health Care | 59 | -0.128 | -1.21 | 15.4% | +7.51% |
Sector Highlights:
Tech momentum is extremely strong: IC 0.524, ICIR 2.58, Q5 (strongest stocks) averaged 27.19% returns vs Q1’s -1.35%, a 28.54% long-short spread. Tech’s momentum effect far exceeds all other sectors.
Financials and Industrials follow: ICIR 2.63 and 2.88 respectively, momentum highly effective in both sectors.
Health Care stands alone — momentum reversal: IC -0.128, ICIR -1.21, IC positive rate only 15.4%. In Health Care, weak-momentum stocks are outperforming strong-momentum stocks, with a +7.51% long-short spread. This is the only sector where momentum fails, possibly due to sector rotation or policy expectations.
Utilities momentum is mild: ICIR 1.01, long-short spread only -0.63%, momentum has limited effect in defensive sectors.
Summary
The market is currently in a textbook momentum-driven regime:
- Momentum is effective in 6 out of 7 sectors, with Tech being exceptionally strong. Trend-following strategies are fully in charge.
- Value factors (EP/FCF/ROE) are collectively reversing — the market is not rewarding fundamental value, instead chasing growth and momentum.
- Health Care is the sole exception with momentum reversal, worth monitoring as a potential sector rotation signal.
- Risk appetite is recovering (volatility factor positive), but beware of excess speculation risk.
- All factors are within normal波动 ranges, no anomaly alerts triggered.
Strategy implication: Momentum strategies can continue to run, but watch for the Health Care reversal signal and concentration risk in Tech.