Factor Lab Daily Report 2026-08-12
August 12, 2026 Factor Lab daily factor testing report. Momentum factor ICIR 2.70 continues to lead the market; Information Technology sector momentum ICIR 2.58 with Q5 monthly return +27.19% showing extreme dispersion. FCF yield factor ICIR -1.43 is the strongest value signal; EP factor ICIR -0.74 with persistent reversal. BP factor ineffective with ICIR only 0.08. Health Care sector momentum reversal ICIR -1.21. Factor data unchanged from prior session as TTM financials are in mid-quarter quiet period.
Factor IC Testing
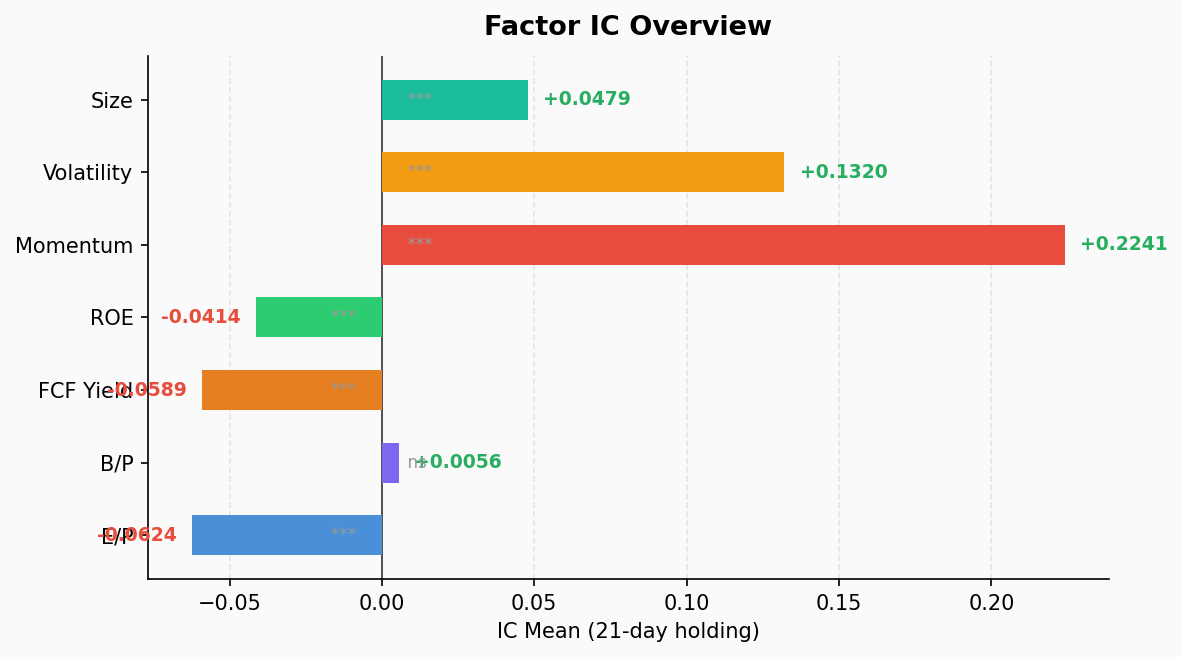
This report presents IC testing results for 7 factors across S&P 500 constituents, with a 21-trading-day holding period and 39 cross-sectional observations.
| Factor | IC Mean | ICIR | t-stat | p-value | IC Positive % | Long-Short (Monthly) |
|---|---|---|---|---|---|---|
| EP (Earnings Price) | -0.0624 | -0.74 ⭐ | -4.57 ⭐ | 0.00005 ⭐ | 17.9% | +3.87% |
| BP (Book Price) | +0.0056 | +0.08 | +0.48 | 0.6355 | 46.2% | +0.82% |
| FCF Yield (Free Cash Flow Yield) | -0.0589 | -1.43 ⭐ | -8.79 ⭐ | 0.00000 ⭐ | 7.7% | +3.04% |
| ROE (Return on Equity) | -0.0414 | -1.23 ⭐ | -7.58 ⭐ | 0.00000 ⭐ | 12.8% | +1.11% |
| Mom (12-1M Momentum) | +0.2241 | +2.70 ⭐ | +16.62 ⭐ | 0.00000 ⭐ | 100.0% | -8.07% |
| Vol (60D Volatility) | +0.1320 | +1.05 ⭐ | +6.48 ⭐ | 0.00000 ⭐ | 79.5% | -7.61% |
| Size (Market Cap) | +0.0479 | +1.25 ⭐ | +7.70 ⭐ | 0.00000 ⭐ | 87.2% | -2.06% |
Key Takeaways:
- Momentum factor continues to dominate: ICIR 2.70, IC positive rate 100% — every cross-sectional period shows positive contribution. Q5 (high momentum) monthly return +7.95%, Q1 (low momentum) -0.12%, long-short spread -8.07% (negative value means high momentum outperforms low momentum). The momentum effect is extremely pronounced under current market conditions; trend-following strategies remain effective.
- EP factor reversal persists: ICIR -0.74, negative IC indicates that high earnings yield stocks have been outperforming low earnings yield stocks recently, consistent with a growth-to-value rotation. Q1 monthly return +6.41% far exceeds Q4’s +0.61%.
- FCF Yield is the strongest value signal: ICIR -1.43, t-stat -8.79, highly significant. High free cash flow yield stocks systematically outperform, Q1 monthly +5.64% vs Q3’s +0.19%. IC positive rate only 7.7%, meaning nearly every cross-section points in the same direction.
- BP factor completely ineffective: ICIR only 0.08, p-value 0.64, cannot reject null hypothesis. Book-to-price has no predictive power for returns; the increasing share of intangible assets in the economy has rendered traditional book value metrics obsolete.
- Volatility factor: ICIR +1.05, positive IC means high-volatility stocks have higher returns, likely reflecting a risk premium. Q5 monthly +8.15% vs Q1’s +0.54%.
- Size factor: ICIR +1.25, IC positive rate 87.2%, large-cap stocks slightly outperforming but the effect is modest.
- Quality factor (ROE) reversal: ICIR -1.23, low-ROE stocks recently outperforming high-ROE stocks, potentially reflecting speculative capital flowing into lower-quality names.
Sector Momentum Decomposition
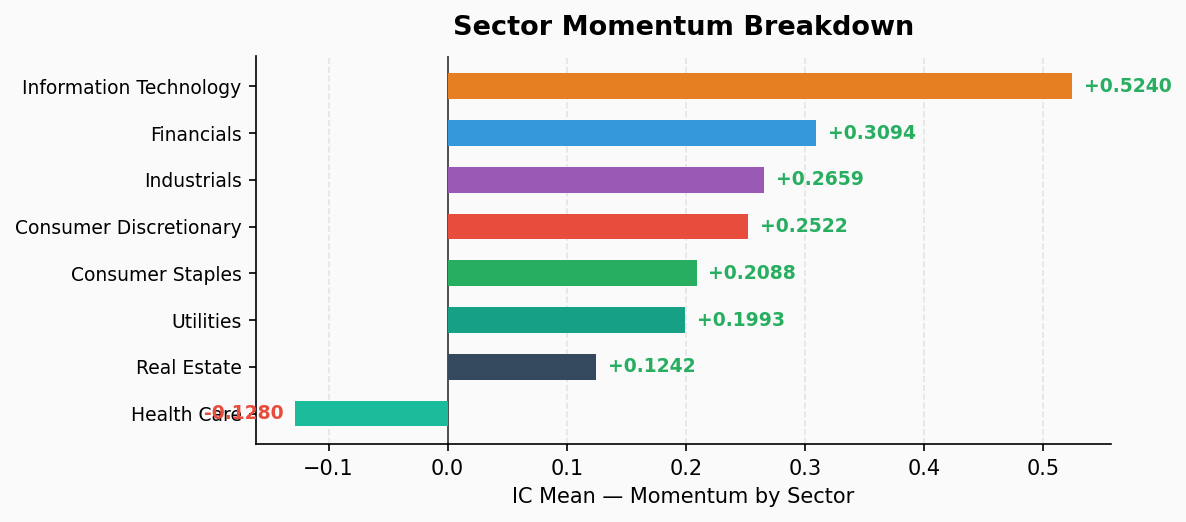
The momentum factor is decomposed by GICS sector to examine differential performance of momentum effects within each sector. Communication Services, Energy, and Materials are excluded due to fewer than 30 samples.
| Sector | Samples | IC Mean | ICIR | IC Positive % | Q5 Monthly Return | Q1 Monthly Return | Long-Short (Monthly) |
|---|---|---|---|---|---|---|---|
| Consumer Discretionary | 48 | +0.2522 | +2.11 | 100% | +2.15% | -4.05% | -6.21% |
| Consumer Staples | 36 | +0.2088 | +1.34 | 87.2% | +0.02% | -4.65% | -4.67% |
| Financials | 76 | +0.3094 | +2.63 | 100% | +7.80% | +0.61% | -7.19% |
| Health Care | 59 | -0.1280 | -1.21 | 15.4% | -2.66% | +4.84% | +7.51% |
| Industrials | 79 | +0.2659 | +2.88 | 100% | +5.51% | -1.63% | -7.14% |
| Information Technology | 73 | +0.5240 | +2.58 | 100% | +27.19% | -1.35% | -28.54% |
| Real Estate | 31 | +0.1242 | +0.84 | 74.4% | +4.95% | +1.12% | -3.83% |
| Utilities | 31 | +0.1993 | +1.01 | 76.9% | -1.66% | -2.29% | -0.63% |
Sector Momentum Highlights:
- Information Technology momentum extremely strong: ICIR 2.58, IC mean 0.524 — the highest across all sectors. Q5 (high momentum) monthly return reaches +27.19%, Q1 (low momentum) only -1.35%, long-short spread -28.54%. The winner-takes-all pattern within tech is very pronounced; momentum strategies yield the most extreme returns in this sector.
- Industrials momentum strongest: ICIR 2.88, the highest across all sectors. IC positive rate 100%, Q5 monthly +5.51% vs Q1’s -1.63%, momentum effect is uniform and persistent.
- Financials momentum robust: ICIR 2.63, IC positive rate 100%. Q5 monthly +7.80%, financial sector momentum strategies perform strongly.
- Health Care momentum reversal: ICIR -1.21, negative IC — the only sector showing momentum reversal. Q1 (low momentum) monthly +4.84% outperforms Q5 (high momentum) at -2.66%. Previously sold-off stocks are showing significant mean reversion; sector rotation signals warrant attention.
- Consumer Discretionary momentum effective: ICIR 2.11, IC positive rate 100%, Q5 outperforms Q1 by ~6.21%.
- Consumer Staples momentum weakening: ICIR 1.34, but Q5 monthly return only +0.02%, momentum has insufficient differentiation within this sector.
- Utilities momentum weak: ICIR 1.01, long-short spread only -0.63%, high homogeneity within the sector limits momentum effectiveness.
- Real Estate momentum moderate: ICIR 0.84, IC positive rate 74.4%, momentum has some effect but is not strong.
Summary
This period’s factor testing results show the market continues to exhibit a strong momentum-driven character, consistent with the recent pattern:
- Momentum factor effective market-wide: ICIR 2.70, IC positive rate 100%, currently the strongest factor. Trend-following strategies remain effective.
- Value factors diverge: EP (ICIR -0.74) and FCF Yield (ICIR -1.43) show significant reversal effects, suggesting recent pressure on high-valuation stocks; BP is ineffective as intangible-asset-driven economic structures render traditional book value metrics meaningless.
- Tech sector extreme dispersion: Information Technology ICIR 2.58, Q5 monthly return +27.19%, a clear winner-takes-all pattern within the sector.
- Health Care counter-trend reversal: The only sector with momentum reversal (ICIR -1.21), previously weak stocks rebounding; sector rotation signals warrant attention.
- Quality factor (ROE) reversal: ICIR -1.23, low-ROE stocks recently outperforming high-ROE stocks, suggesting speculative capital may be flowing into lower-quality names.
Overall assessment: The market remains in a momentum-dominated strong trend phase. Among value factors, FCF Yield and EP continue to provide effective contrarian signals, while BP has lost relevance. At the sector level, particular attention should be paid to extreme momentum in tech and reversal signals in Health Care. All factors are within normal ranges with no anomaly alerts triggered. TTM financials are in the mid-quarter quiet period; factor data is unchanged from the prior session.