Factor Lab Daily Report 2026-08-09
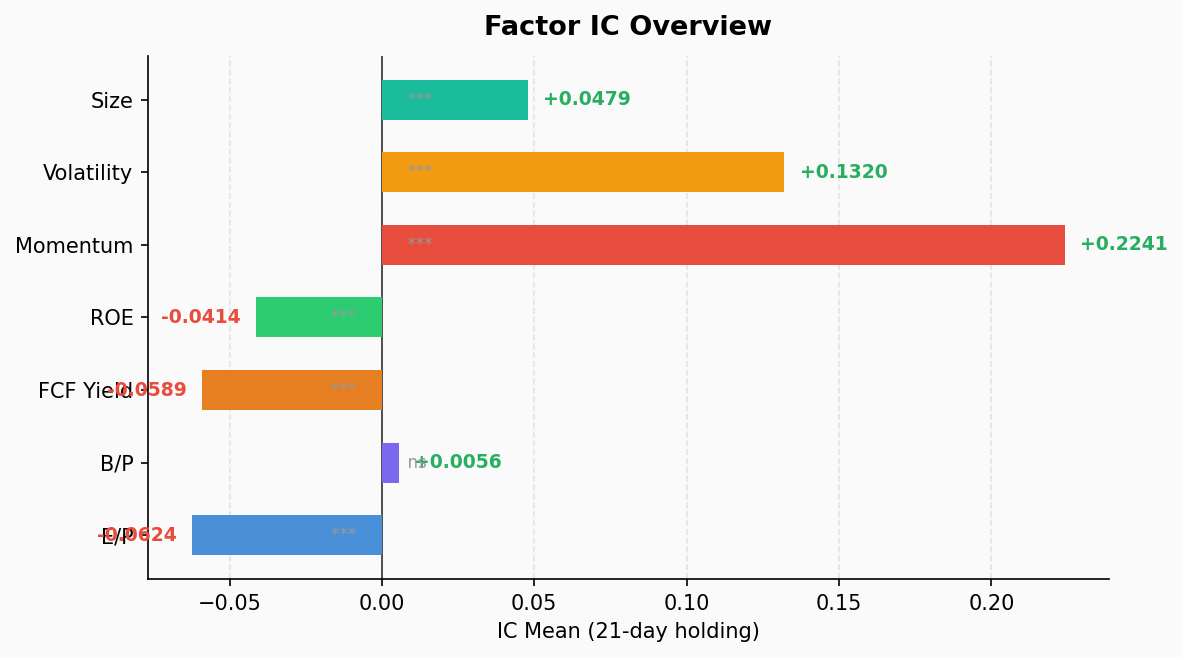
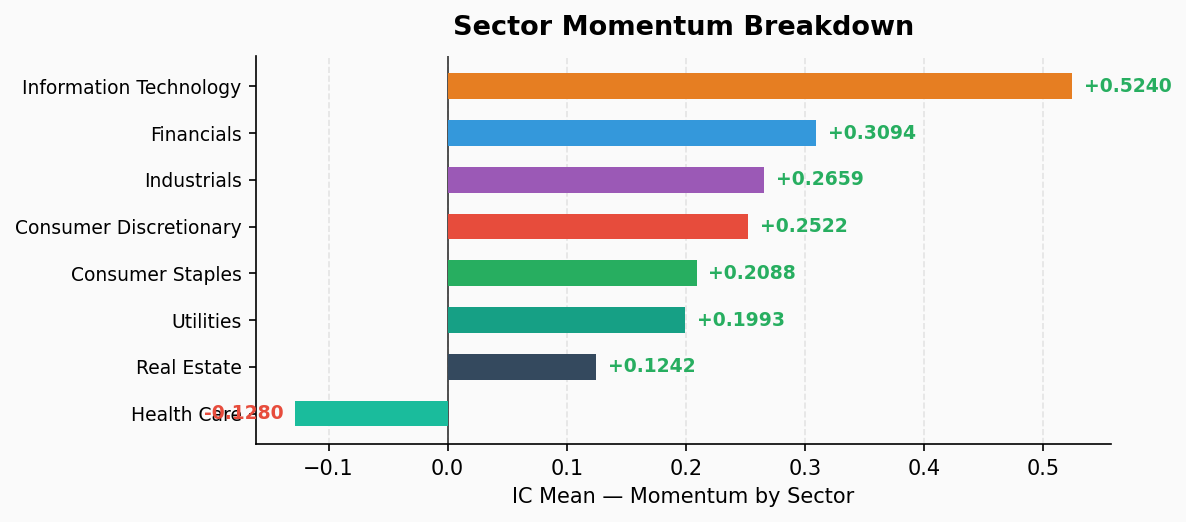
Momentum factor continues to dominate with IC=+0.2241, ICIR=+2.70; IT sector momentum IC reaches +0.5240; Value factors (EP, FCF Yield) maintain negative IC — value trap persists; Health Care is the only sector with negative momentum IC, showing a reversal pattern.
Full Factor IC Test
This report covers 503 US equities (475 for ROE factor), based on daily TTM financial panel data over the past 39 trading days.
| Factor | IC Mean | ICIR | p-value | L/S Return | Significance |
|---|---|---|---|---|---|
| EP (Earnings Yield) | -0.0624 | -0.7418 | 0.00005 ⭐ | +3.87% | Significant |
| BP (Book-to-Price) | +0.0056 | +0.0775 | 0.6355 | +0.82% | Not significant |
| FCF Yield (Free Cash Flow Yield) | -0.0589 | -1.4256 | 0.00000 ⭐ | +3.04% | Significant |
| ROE (Return on Equity) | -0.0414 | -1.2298 | 0.00000 ⭐ | +1.11% | Significant |
| Mom (Momentum) | +0.2241 | +2.6966 | 0.00000 ⭐ | -8.07% | Strongly significant ⭐ Monotonic |
| Vol (Volatility) | +0.1320 | +1.0508 | 0.00000 ⭐ | -7.61% | Significant |
| Size (Market Cap) | +0.0479 | +1.2497 | 0.00000 ⭐ | -2.06% | Significant |
Key Findings:
- Momentum dominates: IC=+0.2241, ICIR=+2.70, with 100% positive IC days across 39 observations. The long-short spread of -8.07% with monotonic quintile returns (Q1=-0.12% → Q5=+7.95%) confirms a powerful trend-following environment.
- Value factors are negative: EP (-0.0624), FCF Yield (-0.0589), and ROE (-0.0414) all show statistically significant negative IC — high-valuation/low-quality stocks are outperforming, a classic growth-over-value regime.
- BP factor is dead: IC≈0 (+0.0056), p=0.64, book-to-price has zero predictive power.
- Volatility factor is positive: IC=+0.1320, high-volatility stocks are being rewarded — market risk appetite remains elevated.
- Large caps leading: Size IC=+0.0479 (positive IC = large caps beating small caps), long-short -2.06%.
Sector Momentum Breakdown
Decomposing the momentum factor by GICS sectors to observe intra-industry momentum strength:
| Sector | N Stocks | IC Mean | ICIR | L/S Return | Monotonicity |
|---|---|---|---|---|---|
| Consumer Discretionary | 48 | +0.2522 | +2.1104 | -6.21% | ⭐ Monotonic |
| Consumer Staples | 36 | +0.2088 | +1.3410 | -4.67% | — |
| Financials | 76 | +0.3094 | +2.6260 | -7.19% | — |
| Health Care | 59 | -0.1280 | -1.2058 | +7.51% | Reversal |
| Industrials | 79 | +0.2659 | +2.8780 | -7.14% | ⭐ Monotonic |
| Information Technology | 73 | +0.5240 | +2.5836 | -28.54% | ⭐ Monotonic |
| Real Estate | 31 | +0.1242 | +0.8397 | -3.83% | — |
| Utilities | 31 | +0.1993 | +1.0065 | -0.63% | — |
Sector Highlights:
- IT momentum is extreme: IC=+0.5240, far exceeding any other sector. Quintile returns climb from Q1’s -1.35% to Q5’s +27.19%, a staggering 28.54% long-short spread. The winner-takes-all dynamic within tech is intensely pronounced.
- Health Care shows reversal: The only sector with negative momentum IC (-0.1280), ICIR=-1.21, statistically significant. Prior losers are outperforming, long-short +7.51% — a potential sector rotation or contrarian signal.
- Industrials & Financials follow suit: Industrials ICIR=+2.88 (highest), Financials ICIR=+2.63, confirming strong momentum effects in cyclical sectors.
- Utilities momentum is weakest: ICIR=+1.01, long-short only -0.63%, defensive sector shows minimal internal momentum dispersion.
Summary
The current market exhibits a textbook growth/momentum-driven regime:
- Momentum crushes value — the ICIR gap is enormous (+2.70 vs -0.74 to -1.43), trend-following strategies far outperform mean-reversion approaches.
- IT concentration risk — momentum IC of 0.52 means capital is increasingly concentrated in top-performing tech names, raising crowding concerns.
- Health Care reversal worth monitoring — the only negative-momentum sector, potentially signaling capital seeking contrarian opportunities within defensives.
- Risk appetite at highs — volatility factor is significantly positive, the market continues to reward high-risk names.
Anomaly detection: All factors are within normal volatility ranges. No extreme anomaly signals.