Factor Lab Daily Report 2026-08-08
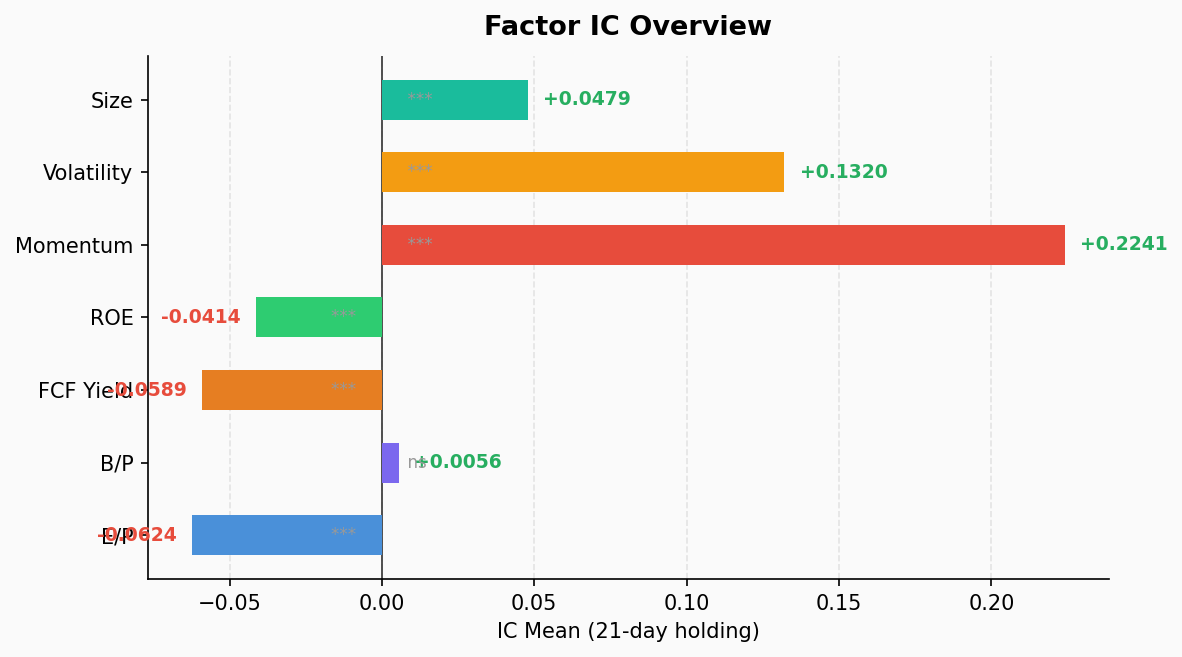
August 8, 2026 factor test report. Momentum factor continues to dominate (ICIR +2.70); IT sector momentum IC reaches 0.524. Value factors all show negative IC — growth overrides value. Health Care shows momentum reversal. No anomaly alerts.
Full Factor IC Test
Test period: 39 trading days, holding period: 21 days, universe: 503 stocks.
| Factor | IC Mean | ICIR | p-value | Long-Short | Significant |
|---|---|---|---|---|---|
| EP (Earnings Yield) | -0.062 | -0.742 | 0.00005 | +3.87% | ⭐ |
| BP (Book-to-Price) | +0.006 | +0.078 | 0.635 | +0.82% | |
| FCF Yield | -0.059 | -1.426 | 0.000 | +3.04% | ⭐ |
| ROE | -0.041 | -1.230 | 0.000 | +1.11% | ⭐ |
| Momentum | +0.224 | +2.697 | 0.000 | -8.07% | ⭐ Monotonic |
| Volatility | +0.132 | +1.051 | 0.000 | -7.61% | ⭐ |
| Size | +0.048 | +1.250 | 0.000 | -2.06% | ⭐ |
Key Readings:
Momentum dominates. ICIR of +2.70 is in a league of its own among all factors, with a 100% IC positive rate — momentum strategy contributed positive IC every single day over the past 39 trading sessions. Quintile sorting is perfectly monotonic: Q5 (strong stocks) averaged +7.95%, Q1 (weak stocks) slightly down at -0.12%, long-short spread -8.07% (negative sign indicates Q5 outperformed Q1).
Value factors collectively negative. EP (IC -0.062), FCF Yield (IC -0.059), and ROE (IC -0.041) all show negative and statistically significant IC. This means high-valuation stocks systematically outperformed low-valuation stocks recently — a classic growth-over-value regime. BP is the only non-significant factor (p=0.635); book value has almost no explanatory power for returns.
Volatility factor positive. IC +0.132, ICIR +1.05. High-volatility stocks underperformed recently (Q1 only +0.54% vs Q5 +8.15%), long-short -7.61%. The positive IC implies high-vol → high-return, which is opposite to the traditional low-volatility premium — more consistent with a risk-on environment.
Large caps lead. Size factor IC +0.048, ICIR +1.25, but modest magnitude (long-short only -2.06%).
Sector Momentum Breakdown
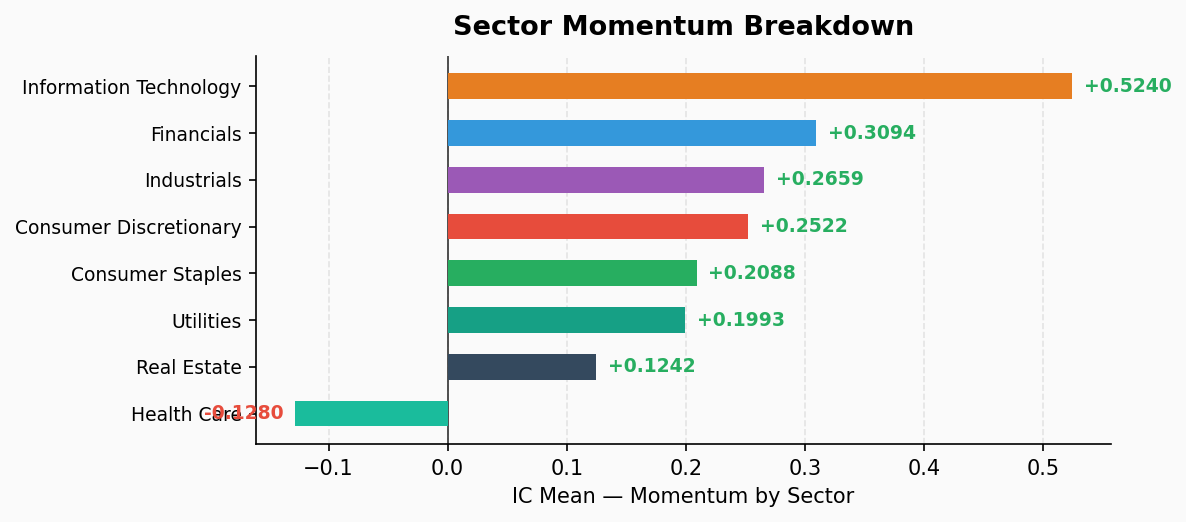
Momentum factor decomposed by GICS sector to examine within-sector momentum strength:
| Sector | Stocks | IC Mean | ICIR | Long-Short | Monotonic |
|---|---|---|---|---|---|
| Information Technology | 73 | +0.524 | +2.584 | -28.54% | ⭐ |
| Financials | 76 | +0.309 | +2.626 | -7.19% | |
| Industrials | 79 | +0.266 | +2.878 | -7.14% | ⭐ |
| Consumer Discretionary | 48 | +0.252 | +2.110 | -6.21% | ⭐ |
| Consumer Staples | 36 | +0.209 | +1.341 | -4.67% | |
| Utilities | 31 | +0.199 | +1.007 | -0.63% | |
| Real Estate | 31 | +0.124 | +0.840 | -3.83% | |
| Health Care | 59 | -0.128 | -1.206 | +7.51% |
Sector Interpretation:
IT momentum off the charts. IC +0.524 is the highest across all sectors, ICIR +2.58, long-short spread -28.54%. Q5 (strong IT stocks) averaged +27.19%, Q1 (weak IT stocks) declined -1.35%. The dispersion within tech is extreme — chasing strong tech stocks has been enormously rewarding. However, a -28.54% spread also means that any reversal will produce sharp drawdowns.
Financials and Industrials follow. Financials ICIR +2.63, Industrials ICIR +2.88, both with 100% IC positive rate. These cyclical sectors show robust momentum effects, consistent with the ongoing economic expansion narrative.
Health Care is the sole reversal. IC -0.128, ICIR -1.21 — momentum is inverted in Health Care. Weak healthcare stocks outperformed strong ones, long-short +7.51%. This typically occurs during defensive rotation phases, where capital rotates from high-flying to laggard names within the sector.
Utilities and Real Estate momentum is weak. ICIR of only 1.01 and 0.84 respectively. Interest-rate-sensitive sectors are not responsive to price momentum.
Summary
The current factor environment is clear: momentum-led, growth over value, large over small. These three directions consistently point to one market regime — capital concentrating in strong leaders, chasing trends rather than mean-reverting.
Warning Signs:
- IT sector momentum IC of 0.524 is an extreme reading historically. This level is often associated with crowded trades; reversal risk increases with time.
- Value factors are comprehensively negative and statistically significant. If a style rotation occurs, the recovery potential for value factors is meaningful.
- Health Care’s momentum reversal is an independent signal — watch whether it spreads to other defensive sectors.
No anomaly alerts. All factors within normal volatility range.