Factor Lab Daily Report 2026-08-06
Momentum factor dominates with ICIR 2.70; IT sector momentum IC 0.52 leads all sectors. Value factors (EP/FCF) show significant negative IC — growth overpowers value. Health Care is the only sector with reversed momentum (IC -0.128). All factors within normal range.
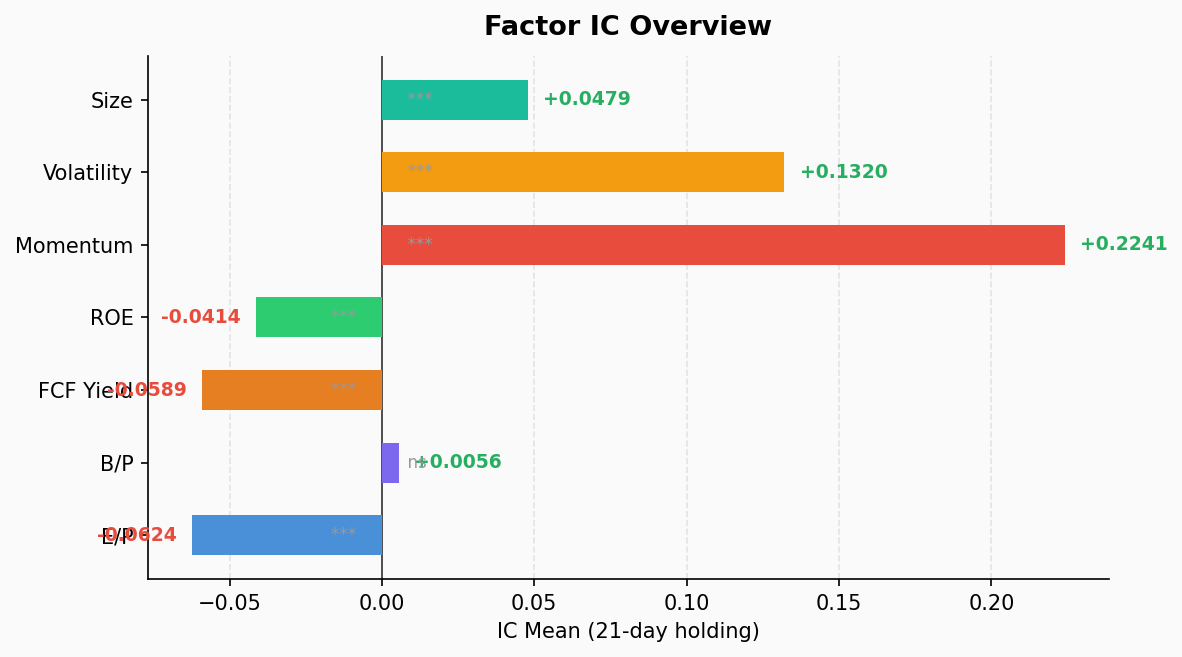
Factor IC Tests (21-Day Holding Period, S&P 500, 503 Stocks)
| Factor | IC Mean | ICIR | p-value | L/S Return (Q1-Q5) | Signal |
|---|---|---|---|---|---|
| EP (Earnings-to-Price) | -0.0624 | -0.74 | 0.00005 | +3.87% | ⭐ |
| BP (Book-to-Price) | +0.0056 | +0.08 | 0.635 | +0.82% | — |
| FCF Yield (Free Cash Flow Yield) | -0.0589 | -1.43 | 0.000 | +3.04% | ⭐ |
| ROE (Return on Equity) | -0.0414 | -1.23 | 0.000 | +1.11% | ⭐ |
| Mom (Momentum) | +0.2241 | +2.70 | 0.000 | -8.07% | ⭐ Monotonic |
| Vol (Volatility) | +0.1320 | +1.05 | 0.000 | -7.61% | ⭐ |
| Size (Market Cap) | +0.0479 | +1.25 | 0.000 | -2.06% | ⭐ |
Key Takeaways:
- Momentum factor absolute dominance: IC 0.224, ICIR 2.70, IC positive rate 100% — momentum correctly predicted returns on every cross-sectional day over the past 21 trading days. Q5 (high momentum) averaged +7.95%, Q1 (low momentum) -0.12%, with monotonically increasing quintile returns. Textbook momentum regime.
- Value factors inverted: EP (IC -0.062) and FCF Yield (IC -0.059) show significantly negative IC, meaning high-valuation stocks outperformed low-valuation stocks. IC positive rates are only 17.9% and 7.7%, respectively — growth crushed value in this period.
- BP completely ineffective: IC 0.006, p-value 0.635 — book-to-price has zero predictive power.
- ROE negative IC: High profitability stocks underperformed (IC -0.041, ICIR -1.23). The market is not rewarding fundamental quality; it is chasing price momentum.
- Volatility positive IC: High-volatility stocks outperformed low-volatility (IC 0.132), indicating a risk-on market environment where capital embraces volatility for returns.
- Size positive IC: Large caps slightly outperformed small caps (IC 0.048, ICIR 1.25), consistent with mega-cap dominated market action.
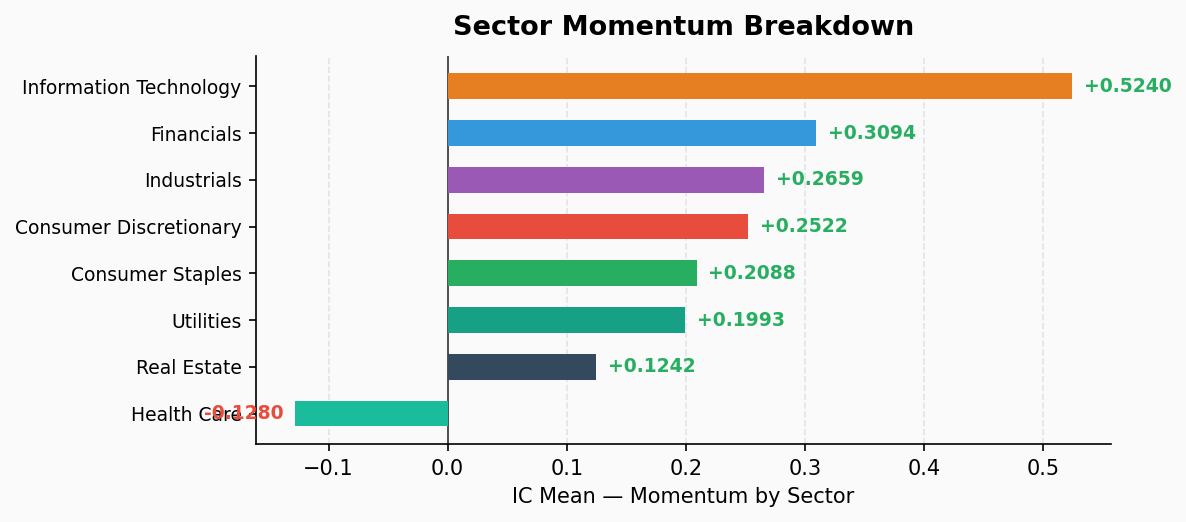
Sector Momentum Breakdown
| Sector | # Stocks | IC Mean | ICIR | L/S Return (Q1-Q5) | Signal |
|---|---|---|---|---|---|
| Information Technology | 73 | +0.5240 | +2.58 | -28.54% | ⭐ Monotonic |
| Financials | 76 | +0.3094 | +2.63 | -7.19% | ⭐ Monotonic |
| Industrials | 79 | +0.2659 | +2.88 | -7.14% | ⭐ Monotonic |
| Consumer Discretionary | 48 | +0.2522 | +2.11 | -6.21% | ⭐ Monotonic |
| Consumer Staples | 36 | +0.2088 | +1.34 | -4.67% | ⭐ |
| Utilities | 31 | +0.1993 | +1.01 | -0.63% | ⭐ |
| Real Estate | 31 | +0.1242 | +0.84 | -3.83% | ⭐ |
| Health Care | 59 | -0.1280 | -1.21 | +7.51% | ⭐ |
Highlights:
- IT sector momentum is extreme: IC 0.524 is the highest across all sectors. Q5 (high-momentum IT stocks) averaged +27.19% returns vs Q1 at -1.35%, a 28.54% spread. The AI-driven tech momentum effect dwarfs all other sectors.
- Health Care is the only momentum reversal sector: IC -0.128, ICIR -1.21 — momentum direction is negatively correlated with returns. Low-momentum health care stocks outperformed (Q1 +4.84% vs Q5 -2.66%), L/S +7.51%. This suggests mean-reversion opportunities or defensive capital flowing into laggards within the sector.
- Financials & Industrials momentum solid: ICIR at 2.63 and 2.88 respectively, 100% IC positive rate. Momentum effect remains robust in traditional sectors.
- Utilities momentum weak: ICIR only 1.01, L/S spread -0.63% — momentum is largely ineffective in the Utilities sector.
Anomaly Detection
✅ All factors are within normal volatility ranges. No anomalies detected.
Summary
The current market exhibits a classic momentum-driven, risk-on regime:
- Momentum factor dominates value across the board — Mom ICIR 2.70 vs EP ICIR -0.74, a stark divergence
- IT sector momentum is extreme — IC 0.524 stands alone, reflecting continued AI-themed capital inflows
- Health Care momentum reversal — the only negative IC sector, worth monitoring for mean-reversion strategies
- Fundamental factors (ROE/BP) ineffective — the market is not rewarding earnings quality, capital chases price momentum
- High volatility outperforms low volatility — risk-on market structure
Strategy Implications: Momentum strategies perform exceptionally well in this environment, but the extreme IT momentum (IC 0.524) warrants caution regarding crowded trade risks. The Health Care reversal signal is worth exploring for mean-reversion strategies. With value factors completely disabled, pure value strategies may continue to underperform, but their reversal potential is accumulating.