Factor Lab Daily Report 2026-08-03
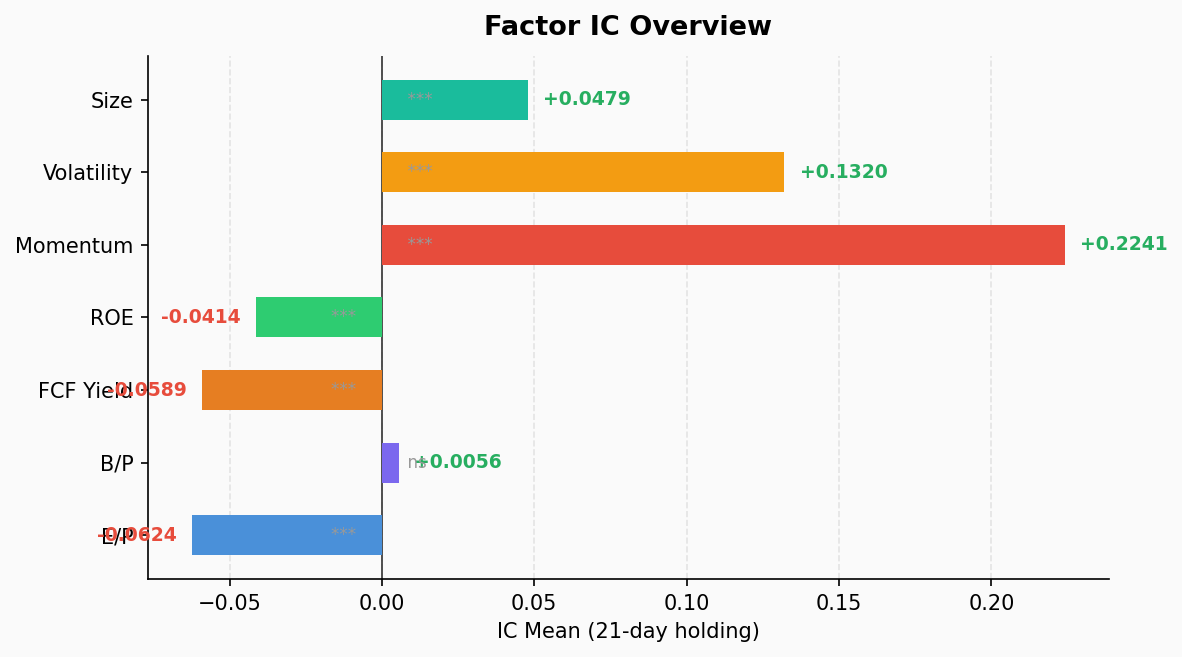
2026-08-03 Factor Report (Monday pre-market, data as of 7/31 close, unchanged from Sunday): Momentum factor IC=+0.224 (ICIR=+2.70), 100% positive IC days, remains strong. Growth significantly outperforms value (EP IC=-0.062, FCF Yield IC=-0.059). High-volatility stocks beat low-volatility (IC=+0.132), large-cap slightly edges small-cap (IC=+0.048). At sector level, IT momentum IC reaches +0.524, Health Care shows reversal signal (IC=-0.128). All factors within normal range, no anomaly alerts.
Overview
- Date: 2026-08-03 (Monday, pre-market, data as of 7/31 close)
- Universe: S&P 500 (503 valid stocks)
- Holding Period: 21 trading days
- IC Observations: 39 periods
- Anomaly Detection: ✅ All factors within normal range
Full Factor IC Tests
| Factor | IC Mean | ICIR | p-value | Q1-Q5 Spread | Monotonicity |
|---|---|---|---|---|---|
| mom (Momentum) | +0.2241 | +2.6966 | 0.000 | -8.07% | ✅ |
| vol (Volatility) | +0.1320 | +1.0508 | 0.000 | -7.61% | — |
| size (Market Cap) | +0.0479 | +1.2497 | 0.000 | -2.06% | — |
| bp (Book-to-Price) | +0.0056 | +0.0775 | 0.635 | +0.82% | — |
| roe (Return on Equity) | -0.0414 | -1.2298 | 0.000 | +1.11% | — |
| fcf_yield (FCF Yield) | -0.0589 | -1.4256 | 0.000 | +3.04% | — |
| ep (Earnings Yield) | -0.0624 | -0.7418 | 0.000 | +3.87% | — |
Q1 = lowest quantile, Q5 = highest quantile. Q1-Q5 > 0 means low quantile outperforms high quantile.
Key Takeaways
Momentum factor dominates. IC +0.224, ICIR +2.70, 100% positive IC days — strongest across all dimensions. Q5 (high momentum) 21-day average return +7.95%, Q1 (low momentum) -0.12%, long-short spread -8.07%, with perfect quintile monotonicity. Trend-following strategies are in their optimal operating regime.
Growth > Value persists. EP (earnings yield) IC -0.062, FCF Yield IC -0.059, both significantly negative, indicating high-valuation (low-yield) growth stocks continue to outperform low-valuation value stocks. EP factor Q1 (low E/P, i.e., growth) returns +6.41%, Q5 (high E/P, value) only +2.54%, spread +3.87%.
Positive volatility IC = risk appetite rising. Vol IC +0.132, high-vol Q5 returns +8.15%, low-vol Q1 only +0.54%. Capital is chasing risk assets; low-volatility defensive strategies are underperforming the market.
Market cap factor weakly positive. Size IC +0.048, large-cap slightly edges small-cap, but spread is only -2.06%, limited differentiation.
BP is the only失效 factor. Book-to-price IC +0.006, ICIR +0.08, p-value 0.635, completely insignificant. Pure value factor lacks predictive power in the current environment.
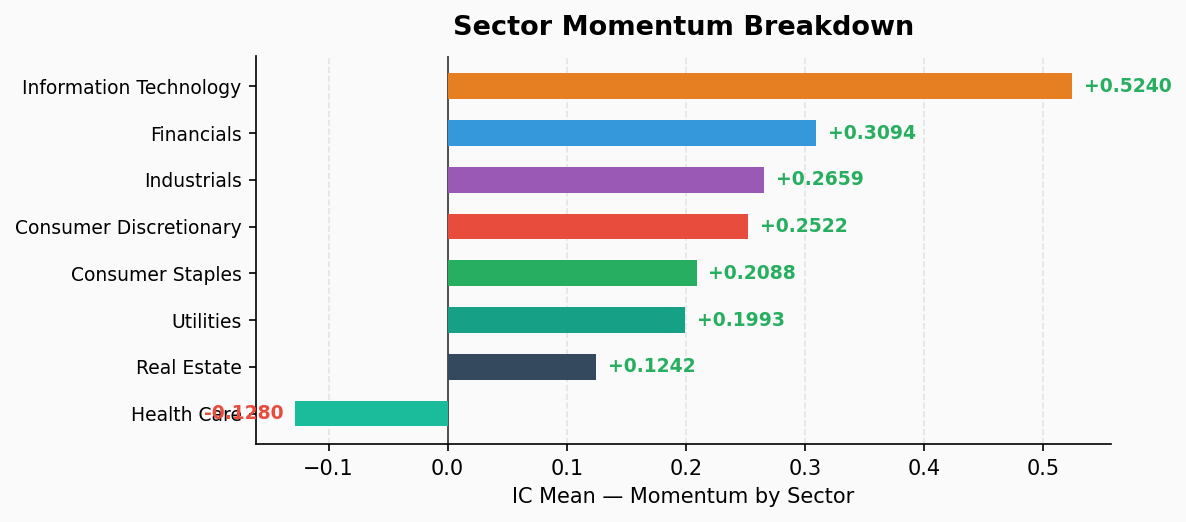
Sector Momentum Breakdown
| Sector | Momentum IC | ICIR | Q1-Q5 | Monotonicity | Sample |
|---|---|---|---|---|---|
| Information Technology | +0.5240 | +2.5836 | -28.54% | ✅ | 73 |
| Financials | +0.3094 | +2.6260 | -7.19% | — | 76 |
| Industrials | +0.2659 | +2.8780 | -7.14% | ✅ | 79 |
| Consumer Discretionary | +0.2522 | +2.1104 | -6.21% | ✅ | 48 |
| Consumer Staples | +0.2088 | +1.3410 | -4.67% | — | 36 |
| Utilities | +0.1993 | +1.0065 | -0.63% | — | 31 |
| Real Estate | +0.1242 | +0.8397 | -3.83% | — | 31 |
| Health Care | -0.1280 | -1.2058 | +7.51% | — | 59 |
Sector Highlights
IT momentum is extremely strong. IC +0.524 is the highest across all sectors, ICIR +2.58. Q5 (high-momentum IT stocks) 21-day return +27.19%, Q1 only -1.35%, spread -28.54%, with perfect quintile monotonicity. The trend acceleration effect in tech is extremely pronounced, but also signals concentration risk.
Financials / Industrials momentum is robust. IC +0.309 and +0.266 respectively, ICIR both >2.1, with Industrials showing quintile monotonicity. Cyclical sector momentum strategies are running well.
Health Care shows reversal signal. Momentum IC -0.128, ICIR -1.21, the only sector with significantly negative momentum. Q1 (low momentum) returns +4.84%, Q5 (high momentum) -2.66%. Mean reversion in previously weak healthcare stocks; momentum strategies should consider reversal logic in this sector.
Summary
Market Regime: Risk Appetite + Growth Leadership + Momentum Acceleration.
- Momentum factor at optimal operating range (ICIR +2.70, 100% positive IC days), trend-following strategies have high win rates
- Value factors completely失效 (EP/FCF Yield both significantly negative IC), growth style dominates the market
- High volatility beats low volatility, capital risk appetite is in an upward channel
- IT sector momentum is extreme (IC +0.524, Q5 return +27.19%), beware concentration risk
- Health Care is the only reversal sector, momentum strategies should be differentiated
- All factors within normal range, no anomaly alerts
⚠️ The above is factor analysis based on historical data and does not constitute investment advice. Factor effectiveness will fluctuate with market conditions.