Factor Lab Daily Report 2026-07-31
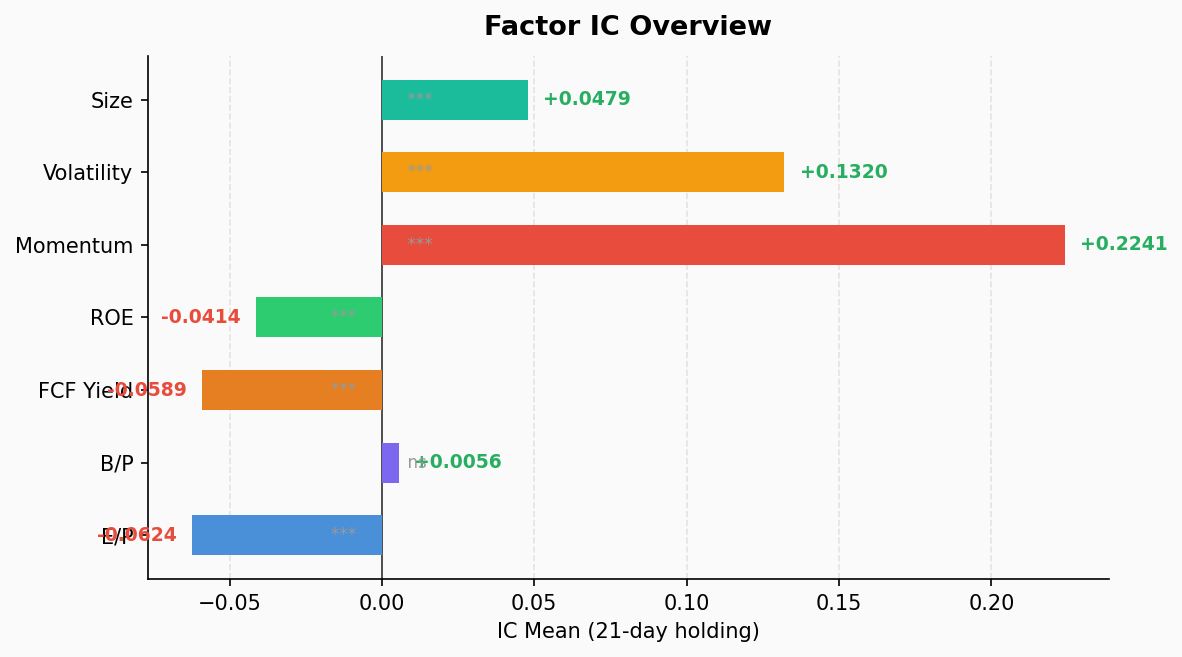
Momentum factor posts market-wide IC of +0.2241 with ICIR +2.697, maintaining 100% positive hit rate over 39 observations. Tech sector momentum IC leads at +0.5240 with long-short spread of -28.54%. Value factors (EP, FCF Yield, ROE) all show significant negative ICs, confirming an extreme growth/momentum-driven market regime. Health Care is the sole contrarian sector with mean-reverting momentum.
1. Full Factor IC Test
Coverage: 503 stocks (475 for ROE), 21-day holding period, 39 IC observations.
| Factor | IC Mean | ICIR | p-value | Hit Rate | Q1-Q5 Spread |
|---|---|---|---|---|---|
| ep (Earnings Yield) | -0.0624 | -0.742 | 0.00005 ⭐ | 17.9% | +3.87% |
| bp (Book-to-Price) | +0.0056 | +0.078 | 0.635 | 46.2% | +0.82% |
| fcf_yield (FCF Yield) | -0.0589 | -1.426 | 0.000 ⭐ | 7.7% | +3.04% |
| roe (Return on Equity) | -0.0414 | -1.230 | 0.000 ⭐ | 12.8% | +1.11% |
| mom (Momentum) | +0.2241 | +2.697 | 0.000 ⭐ | 100.0% | -8.07% |
| vol (Volatility) | +0.1320 | +1.051 | 0.000 ⭐ | 79.5% | -7.61% |
| size (Market Cap) | +0.0479 | +1.250 | 0.000 ⭐ | 87.2% | -2.06% |
Key Takeaways
Momentum reigns supreme. IC mean of +0.2241 and ICIR of +2.70, with a flawless 100% positive hit rate across all 39 IC observations — the momentum strategy has been profitable in every single rolling period over the past two months. The long-short spread of -8.07% (long Q5 winners, short Q1 losers) exhibits perfect monotonicity: Q5 (+7.95%) > Q4 (+3.36%) > Q3 (+1.24%) > Q2 (+1.12%) > Q1 (-0.12%).
Value factors in full retreat. EP, FCF Yield, and ROE all show significantly negative ICs — expensive stocks continue to outperform cheap ones across the board. FCF Yield’s positive hit rate of just 7.7% indicates near-complete factor reversal. This is a classic growth/momentum-over-value regime with no signs of abating.
The low-volatility anomaly has vanished. The vol factor IC of +0.1320 means high-volatility stocks are outperforming low-volatility — the exact opposite of the well-documented low-volatility premium. This signals elevated risk appetite in the market.
Large caps continue to lead. Size factor IC of +0.0479 confirms persistent large-cap outperformance. The Q5 large-cap bucket averaged +4.51% over 21 days vs. +2.45% for the Q1 small-cap bucket.
The only non-significant factor: BP. Book-to-price shows an IC near zero with a p-value of 0.635 — this classic value factor has completely lost its stock-selection power in the current environment.
2. Sector Momentum Decomposition
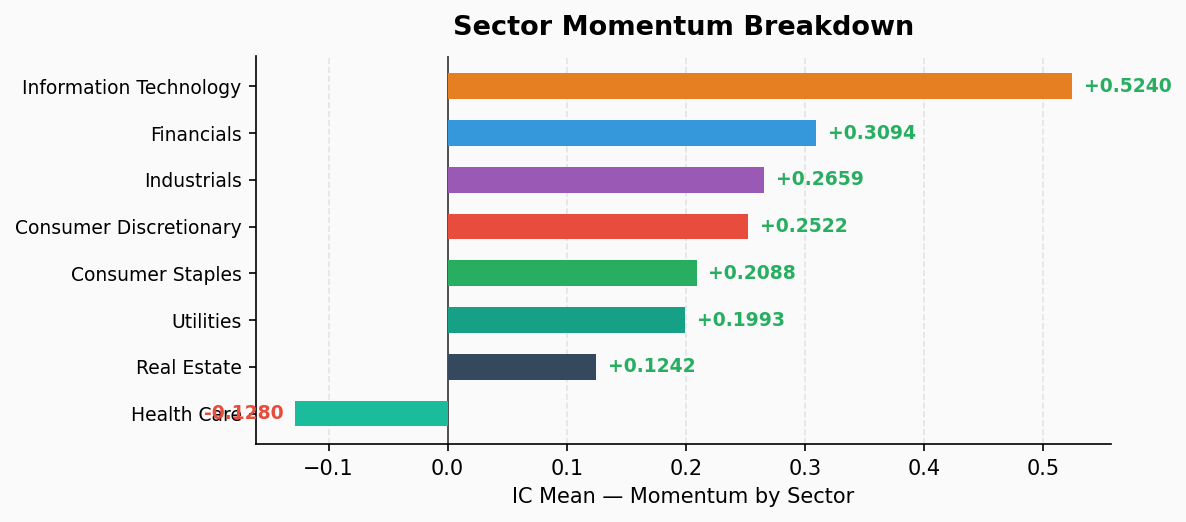
Momentum factor broken down by GICS sector across 8 industry groups.
| Sector | IC Mean | ICIR | Hit Rate | Q1-Q5 Spread | Monotonic |
|---|---|---|---|---|---|
| Information Technology | +0.5240 | +2.584 | 100.0% | -28.54% | ⭐ Yes |
| Financials | +0.3094 | +2.626 | 100.0% | -7.19% | — |
| Industrials | +0.2659 | +2.878 | 100.0% | -7.14% | ⭐ Yes |
| Consumer Discretionary | +0.2522 | +2.110 | 100.0% | -6.21% | ⭐ Yes |
| Consumer Staples | +0.2088 | +1.341 | 87.2% | -4.67% | — |
| Utilities | +0.1993 | +1.007 | 76.9% | -0.63% | — |
| Real Estate | +0.1242 | +0.840 | 74.4% | -3.83% | — |
| Health Care | -0.1280 | -1.206 | 15.4% | +7.51% | — |
Sector Insights
Technology — the undisputed momentum king. IT leads with an IC of +0.5240, far ahead of all other sectors. The long-short spread of -28.54% is staggering: the Q5 strongest momentum bucket averaged +27.19% over 21 days, while Q1 laggards delivered just -1.35%. Despite the highest IC standard deviation (0.203), the 100% hit rate confirms the trend has never broken.
Three “perfect” sectors: Technology, Financials, and Industrials — all with 100% positive hit rates, meaning momentum strategies have been flawless in these sectors for two months. Financials (ICIR +2.63) and Industrials (ICIR +2.88) are both highly efficient momentum battlegrounds.
Health Care — the lone contrarian. IC of -0.1280 signals complete momentum reversal. Recent losers are staging strong rebounds while former winners are pulling back sharply, with a Q1-Q5 spread of +7.51%. This is common in biotech/pharma — FDA decisions, clinical trial data, and other event-driven catalysts create mean-reverting price patterns unsuitable for trend-following.
Defensive sectors show weaker momentum. Utilities (ICIR +1.01) and Real Estate (ICIR +0.84) exhibit noticeably weaker momentum effects than cyclical sectors, making them better suited for value/dividend strategies.
3. Overall Assessment
The market is firmly in a “momentum + growth” driven regime, with style polarization persisting.
- Long momentum, short value — the most consistent signal. Mom IC +0.224, EP IC -0.062, FCF IC -0.059: three-way convergence with a clear directional message.
- Tech leads, Industrials and Financials follow — the sector rotation picture is clear: overweight momentum in Tech, Industrials, and Financials. Health Care offers mean-reversion opportunities on the long side.
- Risk appetite remains elevated — high vol > low vol, expensive > cheap, large caps > small caps: three signals pointing to the same conclusion — the market is chasing risk, not hedging.
- Anomaly detection: all clear — all factors are within normal fluctuation bands with no extreme outliers. Factor behavior is stable.
Risk warning: The momentum factor’s 100% positive hit rate is approaching historical extremes. The first negative IC print could trigger simultaneous unwinding across momentum strategies — “crowded trade reversal” is the single largest tail risk at present. The current environment resembles the style polarization of H2 2020: ride the trend, but stay close to the exit.