Factor Lab Daily 2026-07-30
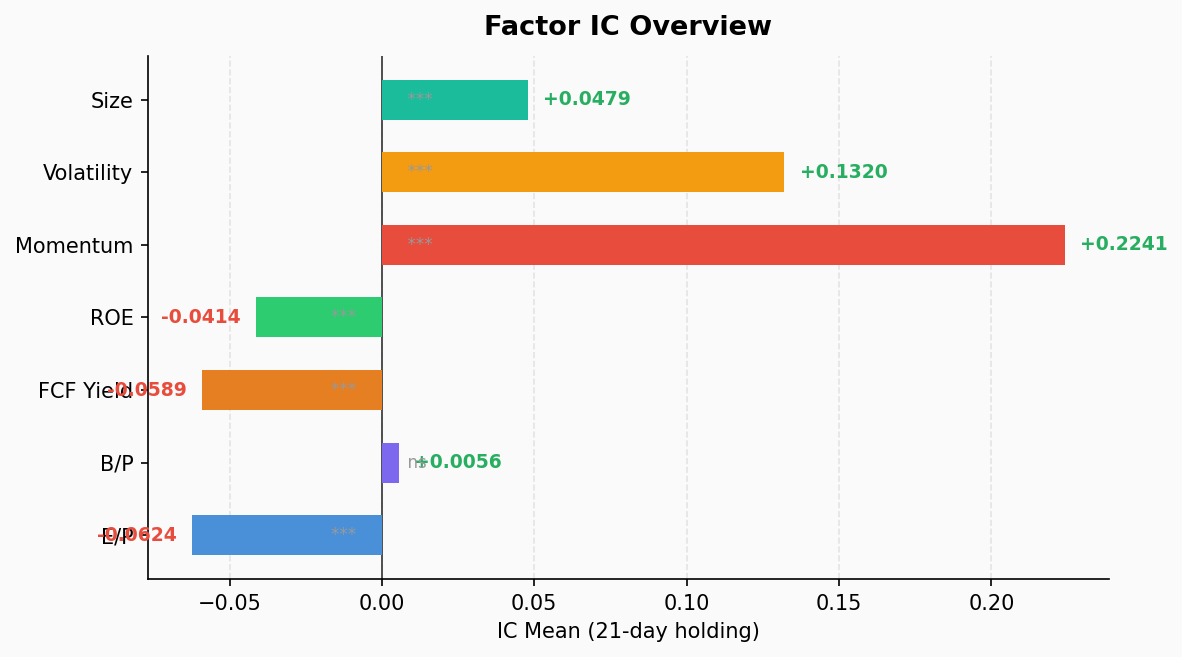
Momentum factor posts market-wide IC of +0.2241 with ICIR +2.697 and a perfect 100% hit rate across 39 periods. Tech sector momentum IC leads at +0.5240 with long-short spread of -28.54%. Value factors (EP, FCF Yield, ROE) are uniformly inverted — the market is in an extreme growth/momentum regime. Size factor favors large caps.
1. Full Factor IC Test
Covering 503 US stocks (475 for ROE), 21-day holding period, 39 IC observations.
| Factor | IC Mean | ICIR | p-value | Hit Rate | Q1-Q5 L/S |
|---|---|---|---|---|---|
| ep (Earnings Yield) | -0.0624 | -0.742 | 0.00005 ⭐ | 17.9% | +3.87% |
| bp (Book-to-Price) | +0.0056 | +0.078 | 0.635 | 46.2% | +0.82% |
| fcf_yield (FCF Yield) | -0.0589 | -1.426 | 0.000 ⭐ | 7.7% | +3.04% |
| roe (Return on Equity) | -0.0414 | -1.230 | 0.000 ⭐ | 12.8% | +1.11% |
| mom (Momentum) | +0.2241 | +2.697 | 0.000 ⭐ | 100.0% | -8.07% |
| vol (Volatility) | +0.1320 | +1.051 | 0.000 ⭐ | 79.5% | -7.61% |
| size (Market Cap) | +0.0479 | +1.250 | 0.000 ⭐ | 87.2% | -2.06% |
Key Takeaways
Momentum is king. IC mean of +0.2241 with ICIR +2.70, and the most striking stat: a 100% hit rate across all 39 IC observations — momentum has made money every single period over the past two months. The long-short spread of -8.07% (Q1 weakest minus Q5 strongest) shows perfect monotonicity: Q5 (+7.95%) > Q4 (+3.36%) > Q3 (+1.24%) > Q2 (+1.12%) > Q1 (-0.12%).
Value factors in full retreat. EP, FCF Yield, and ROE — all three core value factors — show significantly negative ICs, meaning high-valuation stocks continue to outperform cheap ones. This is a classic growth/momentum regime crushing value. FCF Yield’s positive IC hit rate is just 7.7% — nearly a perfect inversion.
The low-volatility anomaly has vanished. The vol factor IC is +0.1320, meaning high-volatility stocks are outperforming low-volatility — the exact opposite of the traditional “low-vol premium.” This signals extremely high risk appetite.
Size favors large caps. Size factor IC +0.0479, large caps consistently outperforming small caps. Q5 large-cap average return +4.51% vs Q1 small-cap +2.45%.
The only insignificant factor: BP. Book-to-price IC near zero with a high p-value — this classic value factor is completely ineffective in the current environment.
2. Sector Momentum Decomposition
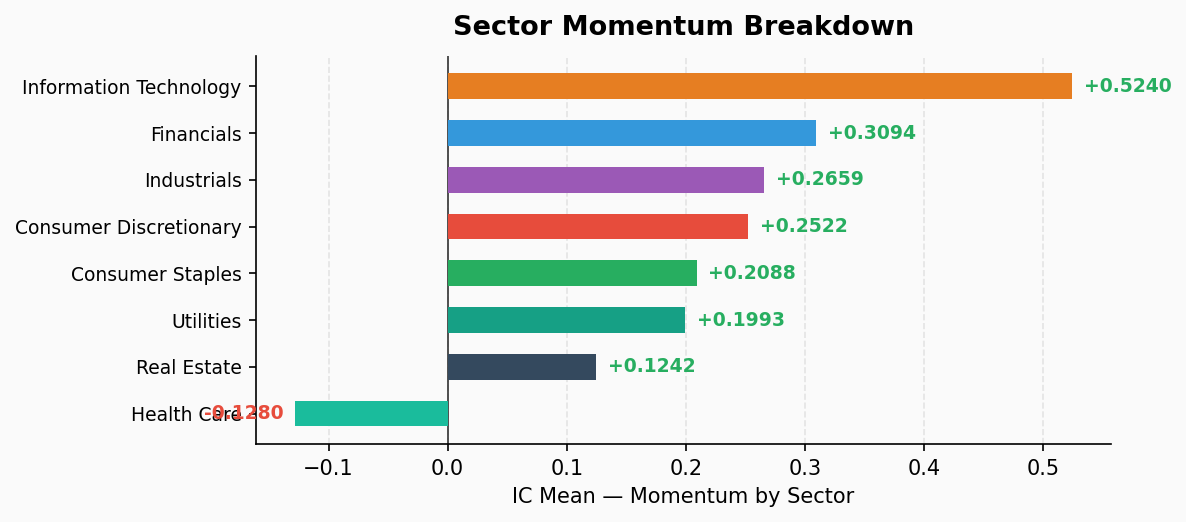
Momentum factor broken down by GICS sector, covering 8 sectors.
| Sector | IC Mean | ICIR | Hit Rate | Q1-Q5 L/S | Monotonic |
|---|---|---|---|---|---|
| Information Technology | +0.5240 | +2.584 | 100.0% | -28.54% | ⭐ Mono |
| Financials | +0.3094 | +2.626 | 100.0% | -7.19% | — |
| Industrials | +0.2659 | +2.878 | 100.0% | -7.14% | ⭐ Mono |
| Consumer Discretionary | +0.2522 | +2.110 | 100.0% | -6.21% | ⭐ Mono |
| Consumer Staples | +0.2088 | +1.341 | 87.2% | -4.67% | — |
| Utilities | +0.1993 | +1.007 | 76.9% | -0.63% | — |
| Real Estate | +0.1242 | +0.840 | 74.4% | -3.83% | — |
| Health Care | -0.1280 | -1.206 | 15.4% | +7.51% | — |
Sector Highlights
Tech — the momentum champion. Information Technology IC mean of +0.5240, far ahead of all other sectors. The long-short spread of -28.54% is massive: Q5 strongest momentum group averaged +27.19% over 21 days, while Q1 weakest was only -1.35%. IC standard deviation is also the highest (0.203), indicating volatility in individual periods — but the 100% hit rate shows this volatility does not disrupt trend persistence.
Three “perfect” sectors: Information Technology, Financials, and Industrials — all with 100% hit rates. Financials lead in ICIR (+2.63), Industrials in statistical significance (ICIR +2.88). Both are ideal hunting grounds for momentum strategies.
Health Care — the lone contrarian. Health Care IC is -0.1280, momentum completely inverted — recent losers are bouncing while winners are pulling back. Q1-Q5 long-short of +7.51% shows strong mean reversion. This is common in biotech/pharma, where FDA decisions and clinical data create event-driven, pulse-like price action.
Defensive sectors show weaker momentum. Utilities and Real Estate both have ICIR below 1.0, suggesting weaker momentum effects — these sectors are better suited for value/dividend strategies.
3. Overall Assessment
The market is in a classic “momentum + growth” regime. The factor picture is unambiguous:
- Long momentum, short value — the most consistent signal across the board. Mom IC +0.224, EP IC -0.062, FCF IC -0.059 — all pointing in the same direction.
- Tech leads, Health Care reverses — overweight Tech/Industrials/Financials momentum has an extremely high win rate, but watch for mean reversion in Health Care.
- Risk appetite is extreme — high vol > low vol, high valuation > low valuation, large cap > small cap — three signals converging on the same conclusion: the market is chasing risk.
- Anomaly check passed — all factors within normal fluctuation ranges, no extreme outliers.
Risk warning: If the momentum factor’s 100% hit rate breaks (first negative IC), it could trigger simultaneous unwinding across crowded momentum strategies. This “crowded trade reversal” risk warrants vigilance. The current environment resembles the polarized style regime of H2 2020 — ride the trend, but don’t be standing at the door when the music stops.