Factor Lab Daily Brief 2026-07-29
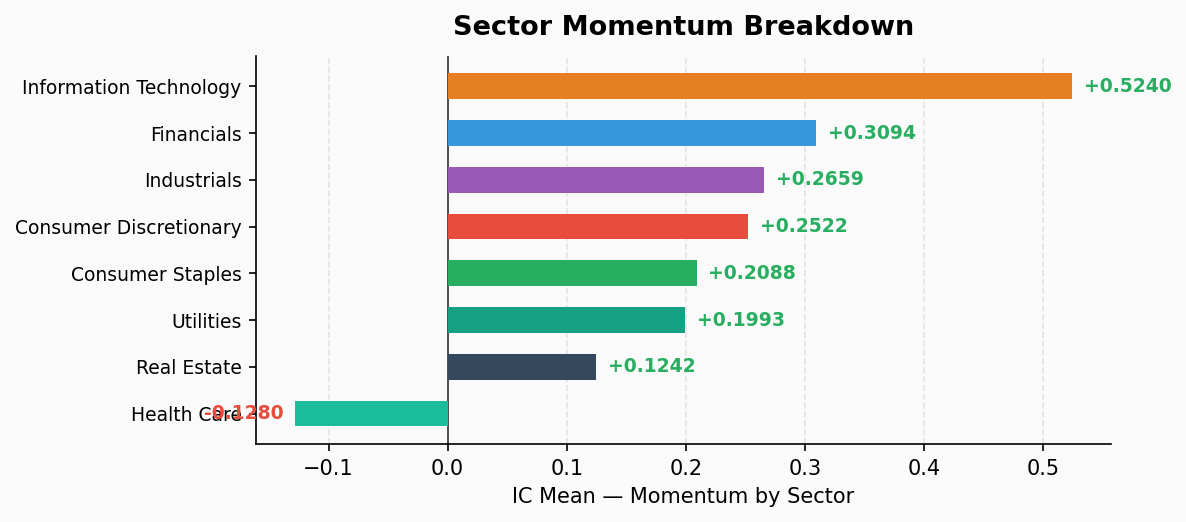
Momentum continues to dominate with IC +0.224 near recent highs. IT sector shows the strongest momentum effect (IC +0.524). Value factors are universally negative — the market is firmly in a growth/momentum regime. Health Care is the only sector showing momentum reversal.
Market Overview
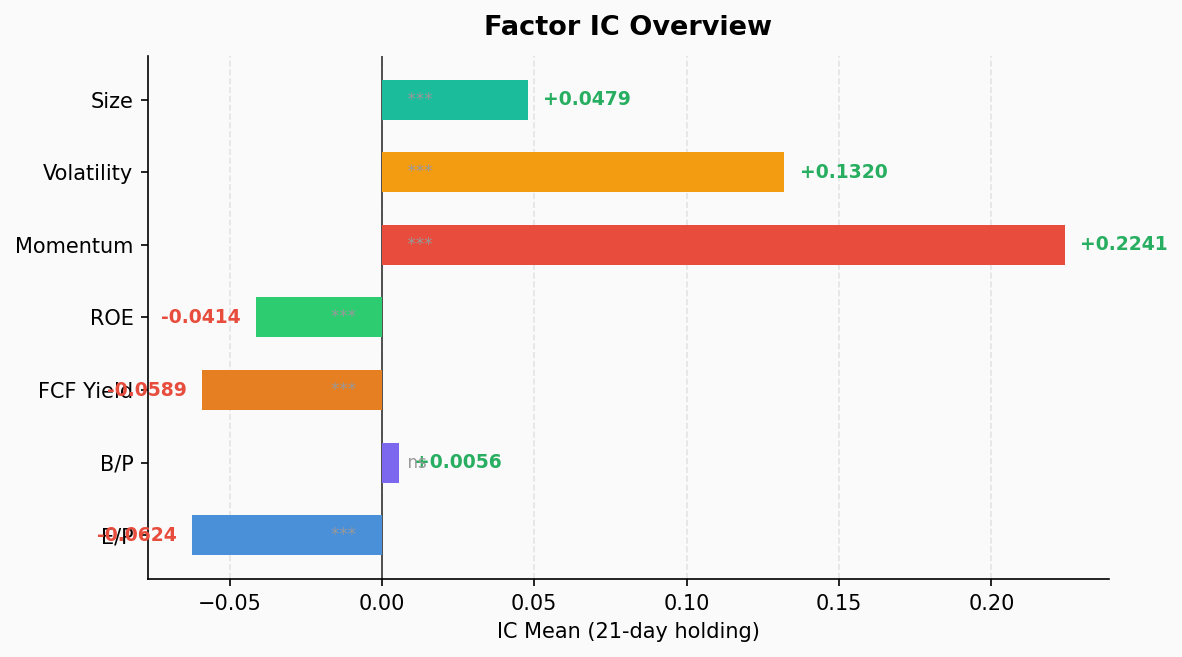
Momentum maintains overwhelming dominance with IC mean +0.224 and ICIR +2.70. All 39 observation windows show positive IC (100% hit rate), a historically rare reading. Q5 (high momentum) vs Q1 (low momentum) long-short spread reaches -8.07%, with the high-momentum quintile averaging +7.95% 21-day returns versus -0.12% for the low-momentum quintile.
Value factors are in full retreat. EP (IC -0.062), FCF Yield (IC -0.059), and ROE (IC -0.041) all show negative ICIR with near-zero p-values. Cheap stocks have consistently underperformed across all 39 windows — the market has zero appetite for “cheap.”
Volatility factor shows IC +0.132, with high-volatility stocks significantly outperforming low-volatility names. This pattern typically emerges during bull market acceleration phases, where high-beta names attract the most capital flows.
Size factor at IC +0.048 indicates large caps outperforming small caps, consistent with the current momentum-driven market structure.
In one sentence: The market is firmly momentum-driven — trend-following works, value investing remains under pressure.
Factor IC Summary
| Factor | IC Mean | ICIR | IC Pos% | L/S Return | Sig |
|---|---|---|---|---|---|
| Momentum (mom) | +0.224 | +2.70 | 100% | -8.07% | ⭐⭐⭐ |
| Volatility (vol) | +0.132 | +1.05 | 79.5% | -7.61% | ⭐⭐⭐ |
| Size | +0.048 | +1.25 | 87.2% | -2.06% | ⭐⭐⭐ |
| Book/Price (bp) | +0.006 | +0.08 | 46.2% | +0.82% | ❌ |
| ROE | -0.041 | -1.23 | 12.8% | +1.11% | ⭐⭐⭐ |
| FCF Yield | -0.059 | -1.43 | 7.7% | +3.04% | ⭐⭐⭐ |
| Earnings Yield (ep) | -0.062 | -0.74 | 17.9% | +3.87% | ⭐⭐⭐ |
⭐⭐⭐: p < 0.001, ⭐⭐: p < 0.01, ⭐: p < 0.05, ❌: not significant
Quintile Return Profiles
Momentum: Near-perfect monotonicity. Returns climb from -0.12% (Q1) to +7.95% (Q5) with each quintile higher than the last — the momentum effect is not only present but highly linear.
FCF Yield: While the overall IC is negative, Q1 (highest FCF Yield) still returns +5.64% vs Q5 at +2.60%, yielding a +3.04% long-short spread. The issue lies in the middle quintiles — Q3 at just +0.19% suggests high noise in the mid-range signal.
Volatility: Q5 (high vol) returns +8.15% vs Q1 (low vol) at just +0.54%, for a -7.61% spread. Caveat: elevated high-vol premiums are often a mid-to-late cycle phenomenon. When the market turns, high-vol names tend to be hit first and hardest.
Sector Momentum Decomposition
Momentum effects are far from uniform across sectors:
| Sector | IC Mean | ICIR | L/S Return | Monotonic |
|---|---|---|---|---|
| Info Tech | +0.524 | +2.58 | -28.54% | ⭐ Yes |
| Financials | +0.309 | +2.63 | -7.19% | — |
| Industrials | +0.266 | +2.88 | -7.14% | ⭐ Yes |
| Cons. Disc. | +0.252 | +2.11 | -6.21% | ⭐ Yes |
| Cons. Staples | +0.209 | +1.34 | -4.67% | — |
| Utilities | +0.199 | +1.01 | -0.63% | — |
| Real Estate | +0.124 | +0.84 | -3.83% | — |
| Health Care | -0.128 | -1.21 | +7.51% | — |
Key Takeaways
Info Tech — King of Momentum. IC +0.524 with Q5 averaging +27.19% 21-day returns, contributing the lion’s share of the overall momentum factor. Persistent AI/semiconductor strength is the primary driver. However, the IC standard deviation (0.203) is also the highest, signaling significant volatility and concentration risk.
Financials — High-ICIR Runner-Up. ICIR +2.63, second only to Industrials. Q5 returns +7.80% vs Q1 at +0.61%. Banks and insurers benefit from the current rate environment.
Industrials — Highest ICIR. ICIR +2.88 tops all sectors, with perfect monotonicity. The industrial sector offers the most stable and reliable momentum effect.
Health Care — The Lone Reversal. IC -0.128 means stocks that performed well over the past 21 days tend to decline over the next 21. Q1 (low momentum) returns +4.84% vs Q5 (high momentum) at -2.66%. The health care sector is experiencing mean reversion — previously strong names face profit-taking pressure.
Anomaly Detection
✅ All factors within normal fluctuation ranges. No anomaly alerts triggered.
Strategy Implications
Momentum strategies remain effective, but sector selection matters. IT, Industrials, and Financials offer the strongest and most stable momentum effects — prioritize these. Avoid momentum strategies in Health Care; consider reversal trades instead.
Value factor underperformance is not a short-term phenomenon. EP, FCF Yield, and ROE all show negative and highly significant ICs — the style rotation has not yet arrived. Left-tail positioning in value factors requires extraordinary patience and risk tolerance.
The high-vol premium warrants caution. High-volatility stocks show clear outperformance, but this pattern has historically appeared near the end of bull cycles. Combined with momentum’s 100% positive IC rate, market sentiment may be running hot.
Sector rotation signal: Health Care’s momentum reversal could be an early indicator of capital rotating out of defensive sectors into cyclicals. Watch for rebound opportunities in low-momentum health care names.
Data: moomoo OpenD | Factor: 21-day price momentum | Lookback: 39 windows | Generated: 2026-07-29 06:51 CST