Factor Lab Daily Brief 2026-07-28
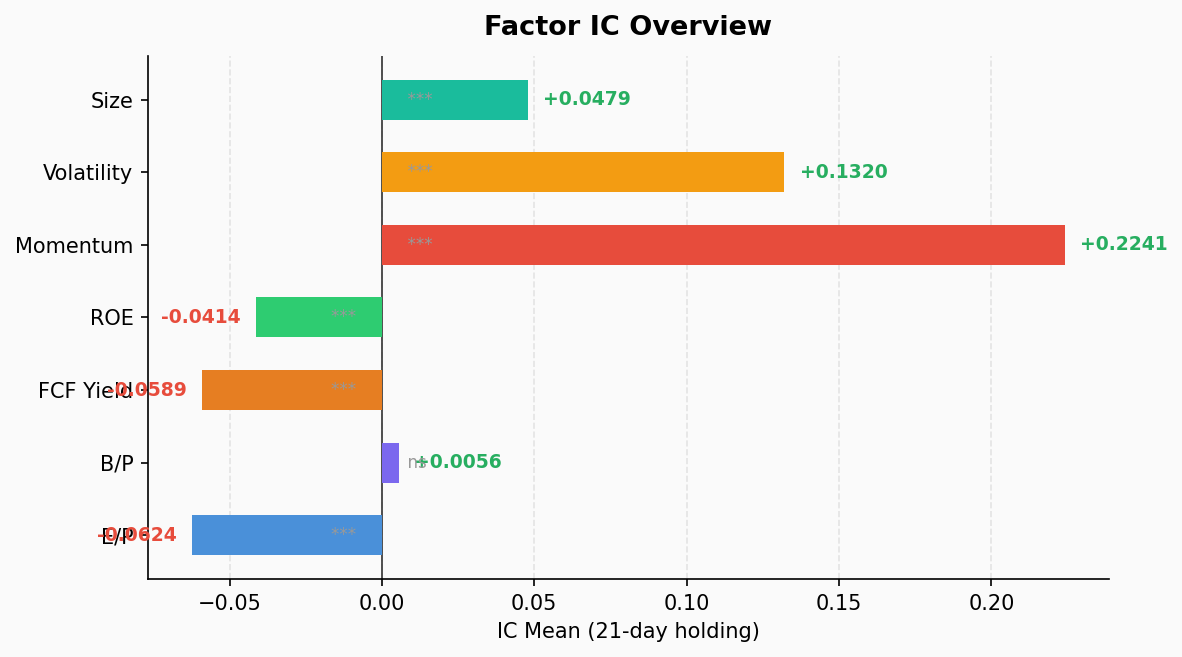
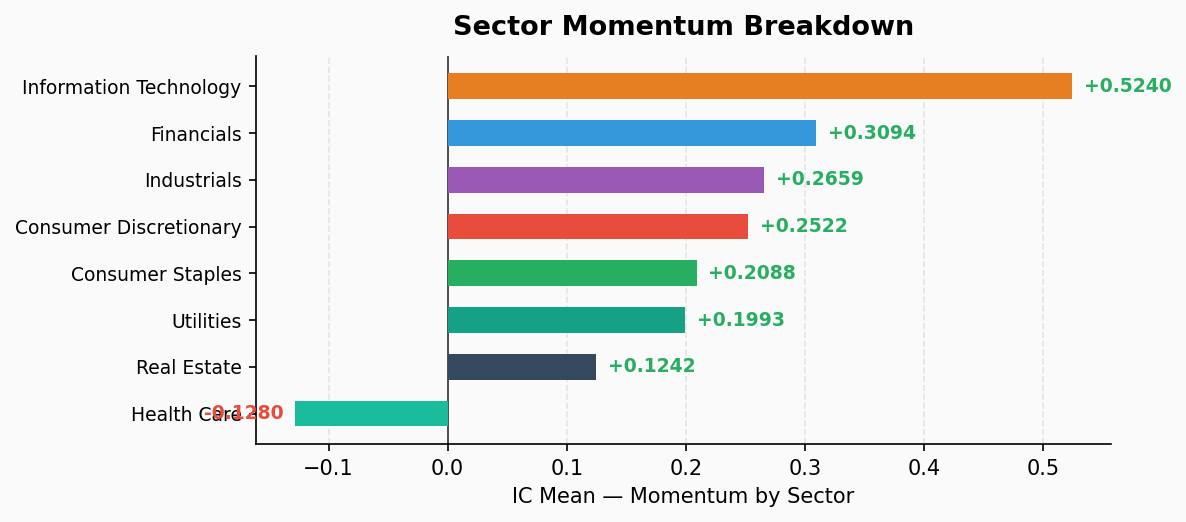
Momentum continues to dominate with ICIR 2.70, the strongest across all factors. Value factors (EP/FCF Yield/ROE) remain uniformly negative. Information Technology leads sector momentum with IC mean 0.524 and Q5 21-day return of 27.19%. Health Care is the only sector exhibiting momentum reversal. BP shows zero differentiation — the market is in a classic trend-following regime.
All-Factor IC Test
Data as of 2026-07-28. Sample covers S&P 500 constituents, 39 cross-sections (~8 months), 21-day holding period.
| Factor | IC Mean | ICIR | t-stat | p-value | IC Win Rate | Q1 Return | Q5 Return | Long-Short |
|---|---|---|---|---|---|---|---|---|
| Momentum | 0.224 | 2.70 | 16.62 | 0.000 | 100.0% | -0.12% | 7.95% | -8.07% |
| Volatility | 0.132 | 1.05 | 6.48 | 0.000 | 79.5% | 0.54% | 8.15% | -7.61% |
| Size | 0.048 | 1.25 | 7.70 | 0.000 | 87.2% | 2.45% | 4.51% | -2.06% |
| BP | 0.006 | 0.08 | 0.48 | 0.635 | 46.2% | 3.88% | 3.06% | 0.82% |
| ROE | -0.041 | -1.23 | -7.58 | 0.000 | 12.8% | 4.82% | 3.71% | 1.11% |
| FCF Yield | -0.059 | -1.43 | -8.79 | 0.000 | 7.7% | 5.64% | 2.60% | 3.04% |
| EP | -0.062 | -0.74 | -4.57 | 0.000 | 17.9% | 6.41% | 2.54% | 3.87% |
Key Findings
Momentum remains unchallenged. IC mean of 0.224, ICIR 2.70, and a 100% positive IC rate — this extreme reading has persisted for multiple days, statistically extraordinary. The Q5 (high momentum) portfolio averaged 7.95% over 21 days, while Q1 (low momentum) returned -0.12%, yielding an 8.07 percentage point long-short spread.
Value factors remain broken across the board. EP, FCF Yield, and ROE all exhibit negative and statistically significant IC. High EP stocks returned only 2.54% over 21 days compared to 6.41% for low EP stocks. This is not “value poised for a comeback” — the market is systematically abandoning value as a style factor. Capital is rewarding high valuations and growth expectations while punishing static cheapness.
BP is the only neutral factor. IC mean and ICIR both near zero, p-value 0.635 insignificant — book-to-price provides zero differentiation in the current market.
High volatility = high returns. Volatility factor IC is positive (0.132), long-short spread -7.61% — high-vol stocks significantly outperform low-vol. Classic risk-on environment: beta is a source of return.
Large-cap preference persists. Size factor IC 0.048, Q5 outperforms Q1 by ~2 percentage points. Small and mid-caps continue to lag as capital concentrates into large caps.
Sector Momentum Decomposition
| Sector | IC Mean | ICIR | IC Win Rate | Q1 Return | Q5 Return | Long-Short |
|---|---|---|---|---|---|---|
| Information Technology | 0.524 | 2.58 | 100.0% | -1.35% | 27.19% | -28.54% |
| Financials | 0.309 | 2.63 | 100.0% | 0.61% | 7.80% | -7.19% |
| Industrials | 0.266 | 2.88 | 100.0% | -1.63% | 5.51% | -7.14% |
| Consumer Discretionary | 0.252 | 2.11 | 100.0% | -4.05% | 2.15% | -6.21% |
| Consumer Staples | 0.209 | 1.34 | 87.2% | -4.65% | 0.02% | -4.67% |
| Utilities | 0.199 | 1.01 | 76.9% | -2.29% | -1.66% | -0.63% |
| Real Estate | 0.124 | 0.84 | 74.4% | 1.12% | 4.95% | -3.83% |
| Health Care | -0.128 | -1.21 | 15.4% | 4.84% | -2.66% | 7.51% |
Information Technology: the momentum king, by a wide margin. IC mean of 0.524, Q5 portfolio delivered 27.19% over 21 days versus -1.35% for Q1 — a near 29 percentage point long-short spread. Winner-take-all dynamics within IT are extreme: the gap between picking right and wrong is nearly 30 percentage points over a single month.
Financials and Industrials: the solid second tier. Both sectors show IC in the 0.26–0.31 range with ICIR above 2.6 — momentum is robust and persistent. Financials’ Q5 returned 7.80% while Q1 was still positive, indicating the entire sector is in an uptrend, with momentum stock selection amplifying gains further.
Health Care: the only reversal sector. IC of -0.128, ICIR -1.21. Q1 (prior laggards) returned the highest at 4.84%, while Q5 (prior winners) returned -2.66%. Health Care is experiencing sharp mean reversion: prior winners are falling back, prior losers are bouncing.
Strategy Implications
The market is in a classic trend-following regime, but crowding risk is rising. Momentum’s dominance (ICIR 2.70, 100% win rate) has persisted for multiple days, indicating strong market directionality. Reversal strategies would have bled consistently during this period.
Do not bottom-fish value — at least not yet. EP, FCF Yield, and ROE are uniformly negative — this is not random noise. The market is systematically rewarding growth and momentum. BP’s neutral reading confirms that even deep value strategies can find no traction.
Sector allocation signal is clear: overweight Tech + Financials, underweight Health Care. Tech and Financials show the strongest momentum with consistent direction. Health Care is in mean-reversion mode. If holding Health Care names, consider taking profits on recent outperformers.
Risk warning: A 100% momentum win rate is unsustainable. Maintaining this extreme reading for multiple consecutive days signals that crowded-trade risk is accumulating. When all factors point in the same direction, position-sizing discipline matters more than chasing returns.