Factor Lab Daily Report 2026-07-25
Full factor IC test + sector momentum decomposition. Momentum factor continues to dominate (ICIR 2.70), IT sector momentum extreme (IC 0.524). Value factors universally failing, EP/FCF/ROE all negative. Fear & Greed at 39.4 (fear territory), market breadth at 14.0 (extreme fear, new low), S&P 500 slightly up to 7412 but breadth deterioration continues. Long-short: chase momentum + avoid value, watch for breadth collapse risk.
1. Factor IC Overview
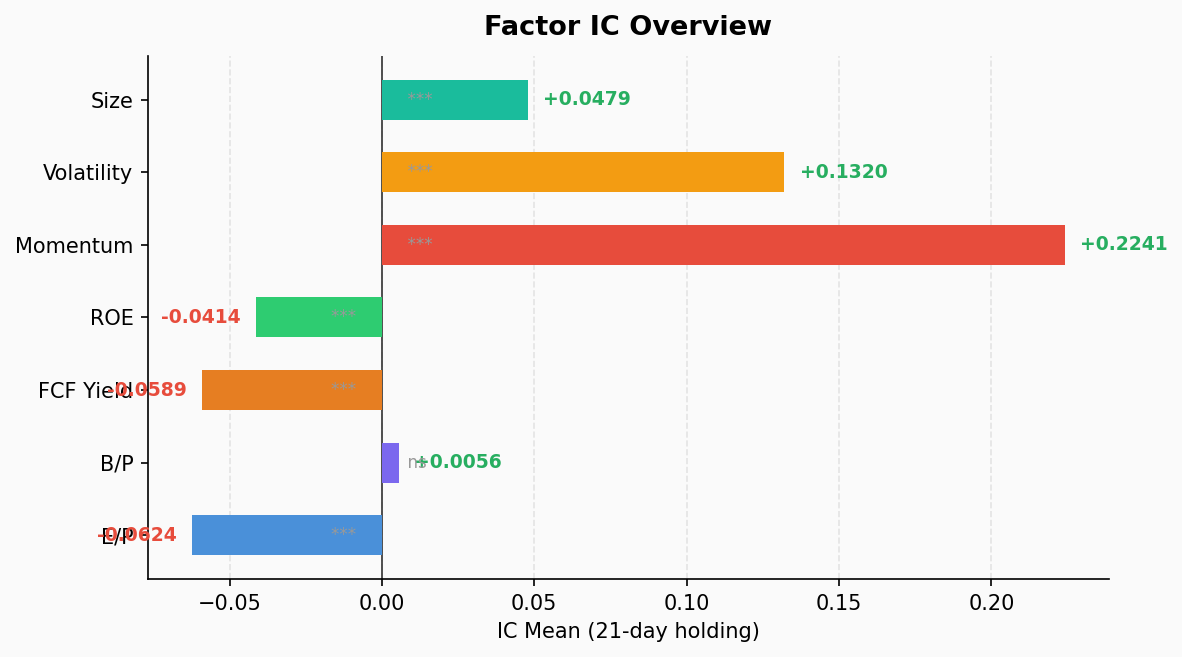
| Factor | IC Mean | ICIR | p-value | IC Positive % | Long-Short | Signal |
|---|---|---|---|---|---|---|
| mom (Momentum) | +0.224 | 2.70 | 0.000 | 100.0% | -8.07% | ⭐⭐⭐ Strongest |
| vol (Volatility) | +0.132 | 1.05 | 0.000 | 79.5% | -7.61% | ⭐⭐ Positive |
| size (Market Cap) | +0.048 | 1.25 | 0.000 | 87.2% | -2.06% | ⭐ Large-cap premium |
| bp (Book-to-Price) | +0.006 | 0.08 | 0.635 | 46.2% | +0.82% | ❌ Not significant |
| ep (Earnings Yield) | -0.062 | -0.74 | 0.000 | 17.9% | +3.87% | ⚠️ Significantly negative |
| fcf_yield (FCF Yield) | -0.059 | -1.43 | 0.000 | 7.7% | +3.04% | ⚠️ Strongly negative |
| roe (ROE) | -0.041 | -1.23 | 0.000 | 12.8% | +1.11% | ⚠️ Significantly negative |
Key Takeaway: The factor landscape remains unchanged from yesterday — momentum (mom) continues to dominate with ICIR 2.70 and 100% IC positive rate. Q5 (high momentum) averages 7.95% monthly vs Q1 (low momentum) -0.12%, for a long-short spread of 8.07%. Value factors (EP/BP/FCF/ROE) are universally failing, with EP and FCF showing significantly negative IC — the market is “punishing” cheap stocks. FCF yield’s IC positive rate is only 7.7%, meaning cheap stocks outperformed in fewer than 1 in 10 cross-sections. This is not a mean-reverting market; it’s a trend-accelerating market. However, market breadth has deteriorated further to 14.0, signaling mounting risk of a style shift.
2. Quintile Return Structure
Momentum factor quintile returns (monthly average):
Q1 (Lowest Mom):  -0.12%  ▏
Q2:               +1.12%  ████
Q3:               +1.24%  █████
Q4:               +3.36%  █████████████
Q5 (Highest Mom): +7.95%  ████████████████████████████████
Perfect monotonicity — strictly increasing from Q1 to Q5. The size factor similarly shows large-cap premium, with Q5 large-caps averaging 4.51% monthly vs Q1 small-caps at 2.45%. The volatility factor continues its anomalous pattern of high-volatility = high-return (Q5 monthly 8.15%), contradicting the traditional low-volatility premium theory — further confirming the “trend acceleration” market characteristic where high volatility accompanies high momentum.
Value factor return distributions remain chaotic: EP and FCF’s Q1 (cheapest) actually delivers the highest returns, confirming that “cheap” in the current environment signals problematic companies, not undervalued opportunities. FCF yield’s Q1-Q5 returns are 5.64%, 3.76%, 0.19%, 1.61%, 2.60% — a near-perfect inverse order of “cheaper is worse.”
3. Sector Momentum Decomposition
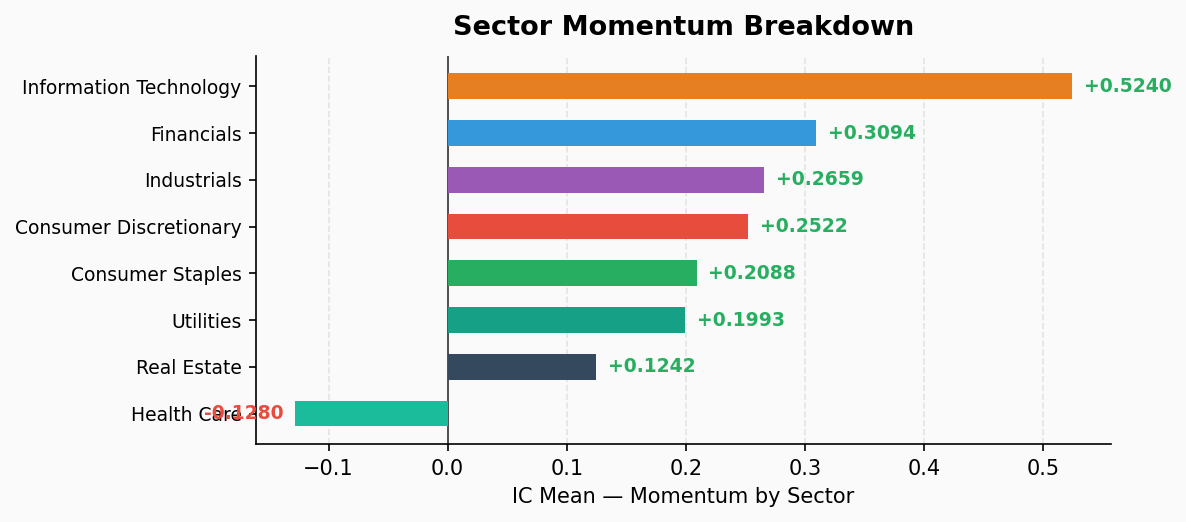
Momentum factor decomposed by sector — not all sectors exhibit effective momentum:
| Sector | IC Mean | ICIR | IC Positive % | Q5 Monthly | Long-Short | Signal |
|---|---|---|---|---|---|---|
| Information Technology | +0.524 | 2.58 | 100.0% | +27.19% | -28.54% | ⭐⭐⭐ |
| Financials | +0.309 | 2.63 | 100.0% | +7.80% | -7.19% | ⭐⭐⭐ |
| Industrials | +0.266 | 2.88 | 100.0% | +5.51% | -7.14% | ⭐⭐⭐ |
| Consumer Discretionary | +0.252 | 2.11 | 100.0% | +2.15% | -6.21% | ⭐⭐ |
| Consumer Staples | +0.209 | 1.34 | 87.2% | +0.02% | -4.67% | ⭐ |
| Utilities | +0.199 | 1.01 | 76.9% | -1.66% | -0.63% | ⭐ |
| Real Estate | +0.124 | 0.84 | 74.4% | +4.95% | -3.83% | Weak |
| Health Care | -0.128 | -1.21 | 15.4% | -2.66% | +7.51% | ⚠️ Reversal |
Key Findings
- IT Sector Momentum Extreme: IC 0.524, Q5 monthly average return 27.19% — the IT sector has entered a self-reinforcing acceleration phase. Q1 (low momentum IT) averages -1.35% monthly, Q5 (high momentum IT) 27.19%, for a long-short spread of 28.54%. Note: the return gradient across Q2-Q4 is also extremely steep (8.17% → 13.62% → 15.91%), indicating momentum premium is not just at extremes but effective across the full spectrum.
- Healthcare Reverse Momentum: IC of -0.128 is the only significantly negative IC across all sectors. Q1 (low momentum) returns 4.84% vs Q5 (high momentum) -2.66%. This sector is mean-reverting — previously strong healthcare stocks are pulling back while oversold names are rebounding. Running momentum strategies in Healthcare is a mismatch.
- Financials and Industrials: Momentum robustly effective, IC 0.27-0.31, ICIR above 2.5, Q5 returns 5-8%, good monotonicity. These two sectors are the second-best momentum strategy venues after IT.
- Consumer Discretionary Momentum Divergence: IC positive (0.252) but Q5 returns only 2.15% — momentum exists but strength is significantly attenuated. Q1 at -4.05% indicates low-momentum consumer stocks carry extreme risk.
- Utilities and Real Estate: Momentum effects are weak, long-short spreads under 4%. Utilities’ Q5 return is actually negative (-1.66%), with a chaotic Q1-Q5 distribution — momentum strategies are nearly ineffective in these defensive sectors.
4. Market Environment Cross-Validation
- Fear & Greed Index: 39.4 (Fear) — Slight decline from 39.6 yesterday, fear persists
- Market Breadth: 14.0 (Extreme Fear) — ⚠️ Worsened from 15.0 yesterday, third consecutive day of new lows. Only 14% of stocks trading above their 20-day moving average
- S&P 500 Level: 7412 — Slight recovery of 4 points (+0.05%) from 7408, stopped falling but not rebounding
- SP500 Market Momentum: 29.2 (Fear) — Index deviating from 125-day MA, momentum continues to weaken
- Stock Price Strength: 34.4 (Fear) — Only 34.4% of stocks near 52-week highs, down from 36.6% yesterday
- VIX Contribution: 50.0 (Neutral) — Volatility not yet warning, but this is a lagging indicator
- Put/Call Ratio: 30.0 (Fear) — Options market defensive, unchanged from yesterday
- Safe Haven Demand: 63.4 (Greed) — Capital chasing safe havens, slightly up from 63.2. Contradictory signal: market fearful but safe haven demand greedy
- Junk Bond Demand: 55.0 (Neutral) — Credit market not yet signaling stress
Factor-Market Relationship
The current environment perfectly explains factor performance:
- Market breadth at extreme fear (14.0, third consecutive day of deterioration) → Capital extremely concentrated in a few large-caps → size factor premium + momentum concentrated in leaders → mom factor extremely effective. This is a “winner takes all” market.
- Persistently elevated risk aversion → Defensive sectors (Healthcare) showing reverse momentum → capital rotating within defensive sectors, not flowing unidirectionally
- Value factors universally failing → Low valuation = problematic companies → market rewards strength, not cheapness. EP factor IC positive rate only 17.9%, FCF only 7.7% — one of the most hostile environments for value investing.
- S&P 500 consolidating in 7408-7412 range → Index not falling further but breadth deteriorating. Classic “false stabilization” — large-caps propping up the index while small/mid-caps continue to bleed.
5. Summary & Strategy Implications
One-Line Summary
This is a momentum-driven, extremely polarized market. Chasing highs works, buying dips is dangerous. Large-caps crush small-caps, IT sector self-reinforcement accelerates. But watch out — market breadth hits new lows for the third consecutive day (14.0), SPX stabilized but breadth deterioration continues, risk is accumulating, not easing.
Strategy Direction
- Momentum Strategy (mom): Currently the most effective single factor, ICIR 2.70, Q5 monthly 7.95%. Long high-momentum + short low-momentum delivers theoretical monthly 8.07%. However: Healthcare momentum is completely ineffective (reverse IC -0.128), should be excluded or reversed. Utilities and Real Estate momentum also weak, recommend avoiding.
- Value Strategy (EP/BP/FCF/ROE): Avoid entirely. In the current environment, “buying cheap” equals “buying junk.” FCF yield’s IC positive rate of only 7.7% means cheap stocks outperform less than 10% of the time. Revisit value only after market breadth recovers and Fear & Greed returns to greed territory.
- Sector Allocation: Overweight high-momentum stocks in IT, Financials, Industrials → underweight or avoid high-momentum Healthcare stocks → neutral on Consumer Discretionary and Utilities
- Risk Alert (Upgraded): Market breadth at 14.0 is extreme fear territory, third consecutive day of new lows. S&P 500 barely up 4 points to 7412, but stock price strength (34.4%) and breadth (14.0%) are deteriorating simultaneously — classic “index stabilizing, internals hemorrhaging” pattern. If large-caps begin to pull back, small/mid-caps have zero support capacity and the selloff would be violent. VIX currently at 50.0 neutral, but a break above 55-60 would be the final confirmation signal. Stay vigilant, control position sizes.
Data Source: Factor Lab v2.0 (S&P 500 Constituent Panel Data) | Generated: 2026-07-25 06:49 CST