Factor Lab Daily Report 2026-07-23
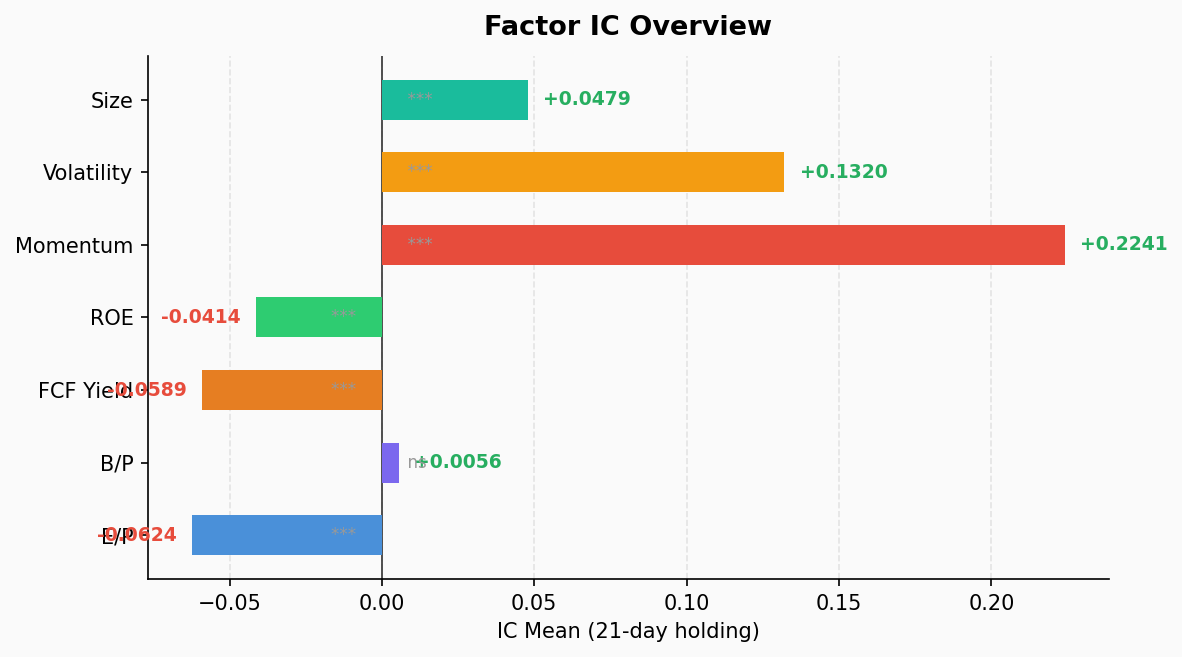
Full factor IC test + sector momentum decomposition. Momentum factor remains dominant (ICIR 2.70), IT sector momentum is off the charts (IC 0.524). Value factors universally failing — EP/FCF/ROE all significantly negative. Fear & Greed at 42.8 (fear), market breadth at extreme fear (18.8), large caps crushing small caps. Long-short structure: chase momentum + avoid value.
1. Factor IC Overview
| Factor | IC Mean | ICIR | p-value | IC Pos% | L/S Return | Signal |
|---|---|---|---|---|---|---|
| mom (Momentum) | +0.224 | 2.70 | 0.000 | 100.0% | -8.07% | ⭐⭐⭐ Strongest |
| vol (Volatility) | +0.132 | 1.05 | 0.000 | 79.5% | -7.61% | ⭐⭐ Positive |
| size (Market Cap) | +0.048 | 1.25 | 0.000 | 87.2% | -2.06% | ⭐ Large premium |
| bp (Book/Price) | +0.006 | 0.08 | 0.635 | 46.2% | +0.82% | ❌ Not significant |
| ep (Earnings Yield) | -0.062 | -0.74 | 0.000 | 17.9% | +3.87% | ⚠️ Negative |
| fcf_yield (FCF Yield) | -0.059 | -1.43 | 0.000 | 7.7% | +3.04% | ⚠️ Strong negative |
| roe (ROE) | -0.041 | -1.23 | 0.000 | 12.8% | +1.11% | ⚠️ Negative |
Key takeaway: Momentum factor (mom) continues to dominate with ICIR 2.70 and 100% IC positive rate. Q5 (high momentum) averages 7.95% monthly vs Q1 (low momentum) -0.12%, a long-short spread of 8.07%. Value factors (EP/BP/FCF/ROE) are universally failing — cheap stocks aren’t just underperforming, they’re consistently losing. This is not a mean-reverting market; it’s a trend-accelerating market.
2. Quantile Return Structure
Momentum factor quantile returns (monthly average):
Q1 (Lowest momentum):  -0.12%  ▏
Q2:                    +1.12%  ████
Q3:                    +1.24%  █████
Q4:                    +3.36%  █████████████
Q5 (Highest momentum): +7.95%  ████████████████████████████████
Monotonicity is perfect — strictly increasing from Q1 to Q5. The size factor similarly shows a large-cap premium: Q5 (largest) averages 4.51% vs Q1 (smallest) 2.45%. The volatility factor exhibits an anomalous high-volatility-high-return pattern (Q5 monthly 8.15%), contradicting traditional low-volatility premium theory.
Value factor return distributions are chaotic: EP and FCF’s Q1 (cheapest) actually shows the highest returns, indicating that “cheap” in the current environment signals troubled companies rather than undervalued opportunities.
3. Sector Momentum Decomposition
Momentum effectiveness varies dramatically by sector:
| Sector | IC Mean | ICIR | IC Pos% | Q5 Monthly | L/S Return | Signal |
|---|---|---|---|---|---|---|
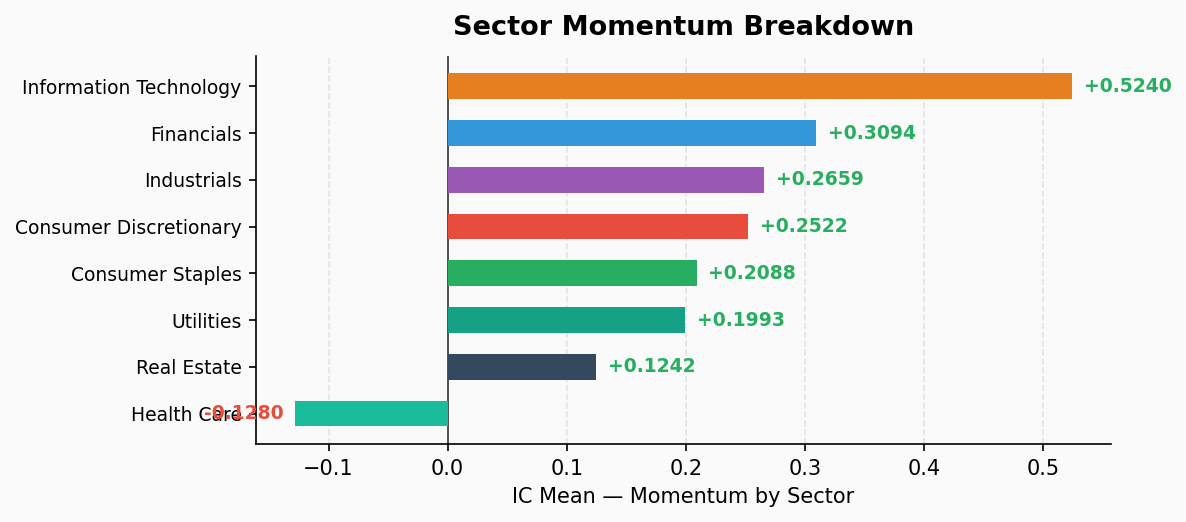
| Information Technology | +0.524 | 2.58 | 100.0% | +27.19% | -28.54% | ⭐⭐⭐ |
| Financials | +0.309 | 2.63 | 100.0% | +7.80% | -7.19% | ⭐⭐⭐ |
| Industrials | +0.266 | 2.88 | 100.0% | +5.51% | -7.14% | ⭐⭐⭐ |
| Consumer Discretionary | +0.252 | 2.11 | 100.0% | +2.15% | -6.21% | ⭐⭐ |
| Consumer Staples | +0.209 | 1.34 | 87.2% | +0.02% | -4.67% | ⭐ |
| Utilities | +0.199 | 1.01 | 76.9% | -1.66% | -0.63% | ⭐ |
| Real Estate | +0.124 | 0.84 | 74.4% | +4.95% | -3.83% | Weak |
| Health Care | -0.128 | -1.21 | 15.4% | -2.66% | +7.51% | ⚠️ Reversed |
Key Findings
- IT sector momentum is extreme: IC 0.524, Q5 monthly returns 27.19% — almost self-perpetuating. The AI/semiconductor chain’s self-reinforcing mechanism continues operating. Q1 (low momentum IT) averages -1.35% monthly, with a staggering 28.54% long-short spread.
- Healthcare shows reverse momentum: IC -0.128, the only sector with significant negative IC. Q1 (low momentum) returns 4.84% vs Q5 (high momentum) -2.66%. This sector is mean-reverting — previously strong healthcare names are pulling back while oversold names are bouncing.
- Financials and Industrials: Momentum is robust and effective, IC 0.27-0.31, ICIR above 2.5, Q5 returns 5-8%, with good monotonicity.
- Consumer Discretionary momentum divergence: IC is positive (0.252) but Q5 returns only 2.15%, momentum exists but strength has decayed significantly.
- Utilities and Real Estate: Momentum effects are weak, long-short spreads under 4%.
4. Market Environment Cross-Validation
- Fear & Greed Index: 42.8 (Fear) — Market sentiment is cool but not extreme
- Market Breadth: 18.8 (Extreme Fear) — ⚠️ Very few stocks rising, capital highly concentrated in a few large caps
- S&P 500 Level: 7499 — Index remains elevated, but deteriorating breadth signals a “false prosperity”
- VIX Contribution: 50.0 (Neutral) — Volatility not yet signaling alarm
- Put/Call Ratio: 31.0 (Fear) — Options market leaning defensive
- Safe Haven Demand: 67.2 (Greed) — Capital chasing safe havens, contradictory signal
Factor-Market Environment Relationship
Current conditions perfectly explain factor performance:
- Extreme fear breadth → Capital floods into few large caps → size factor premium + momentum concentrated in leaders → mom factor extremely effective
- Elevated risk aversion → Defensive sectors (Healthcare, Utilities) show reverse momentum → capital rotating within defensive sectors
- Value factors universally failing → Low valuation = troubled companies → market rewards strength, not cheapness
5. Summary & Strategy Implications
One-Line Summary
This is a momentum-driven, extremely bifurcated market. Chasing winners works, buying dips is dangerous. Large caps crush small caps, IT sector self-reinforcement accelerates.
Strategy Direction
- Momentum strategy (mom): Currently the most effective single factor, ICIR 2.70, Q5 monthly 7.95%. Long high-momentum + short low-momentum theoretically yields 8.07% monthly. Caveat: Healthcare sector momentum is ineffective (reversed) — exclude or reverse positions in this sector.
- Value strategies (EP/BP/FCF/ROE): Avoid entirely. In this environment, “buying cheap” equals “buying junk.” Revisit value mean-reversion only after breadth recovers and Fear & Greed returns to greed territory.
- Sector allocation: Overweight high-momentum names in IT, Financials, Industrials → Underweight or avoid high-momentum Healthcare names → Neutral on Consumer Discretionary and Utilities
- Risk alert: Market breadth at 18.8 (extreme fear) is a danger signal. Elevated index + deteriorating breadth = if large caps start pulling back, the index decline will be violent without mid/small cap support. Monitor VIX — if it jumps from 50 to 65+, consider reducing exposure.
Data source: Factor Lab v2.0 (S&P 500 constituent panel data) | Generated: 2026-07-23 06:50 CST