Factor Lab Daily Brief 2026-07-21
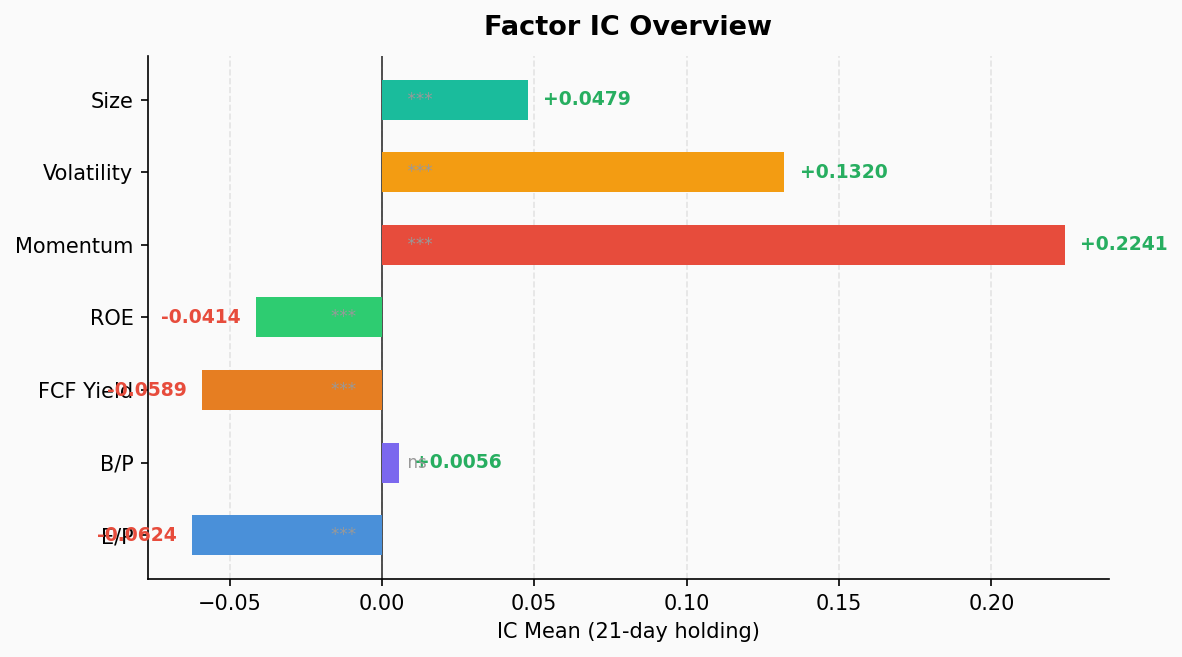
Momentum factor continues to dominate (IC +0.224, ICIR +2.70), with IT sector momentum long-short spread at -28.5%. Value factors remain systematically broken across the board. Health Care is the sole momentum reversal sector (IC -0.128), style rotation ongoing.
1. Full Factor IC Test
Based on S&P 500 constituents, 21-day holding period, 39-week IC series.
| Factor | IC Mean | ICIR | IC>0 Rate | p-value | Long-Short (Q1-Q5) | Signal |
|---|---|---|---|---|---|---|
| ep (Earnings Yield) | -0.062 | -0.74 | 17.9% | 0.000 | +3.87% | ⚠️ Significant Reversal |
| bp (Book-to-Price) | +0.006 | +0.08 | 46.2% | 0.635 | +0.82% | ❌ Ineffective |
| fcf_yield (FCF Yield) | -0.059 | -1.43 | 7.7% | 0.000 | +3.04% | ⚠️ Significant Reversal |
| roe (Return on Equity) | -0.041 | -1.23 | 12.8% | 0.000 | +1.11% | ⚠️ Significant Reversal |
| mom (Momentum) | +0.224 | +2.70 | 100.0% | 0.000 | -8.07% | ✅ Monotonic |
| vol (Volatility) | +0.132 | +1.05 | 79.5% | 0.000 | -7.61% | ✅ Effective |
| size (Market Cap) | +0.048 | +1.25 | 87.2% | 0.000 | -2.06% | ✅ Effective |
2. Key Findings
Momentum Reigns Supreme
The momentum factor posts an IC mean of +0.224 with ICIR +2.70 and a 100% positive IC rate. Over the past 39 weeks, momentum has never failed — every single IC observation has been positive. The long-short spread of -8.07% is monotonically decreasing: Q1 weakest (-0.12%), Q5 strongest (+7.95%). This is textbook factor performance.
Value Factors in Systemic Decline
All three value factors (EP, FCF_Yield, ROE) exhibit negative and highly significant ICs. FCF_Yield’s positive IC rate is only 7.7%, ROE at 12.8%, EP at 17.9% — this is not occasional failure, but systematic underperformance. The market remains in classic growth/momentum dominance mode: cheap gets cheaper, expensive gets more expensive.
Volatility and Size Factors Stable
Low-volatility strategies are failing (high-volatility stocks are outperforming), with a long-short spread of -7.61%. Large caps continue to beat small caps (size factor IC +0.048), consistent with the classic large-cap growth leadership pattern in momentum bull markets.
3. Momentum by Sector
| Sector | IC Mean | ICIR | IC>0 Rate | Long-Short | Signal |
|---|---|---|---|---|---|
| Consumer Discretionary | +0.252 | +2.11 | 100.0% | -6.21% | ✅ Monotonic |
| Consumer Staples | +0.209 | +1.34 | 87.2% | -4.67% | ✅ |
| Financials | +0.309 | +2.63 | 100.0% | -7.19% | ✅ |
| ⚠️ Health Care | -0.128 | -1.21 | 15.4% | +7.51% | 🔄 Reversal |
| Industrials | +0.266 | +2.88 | 100.0% | -7.14% | ✅ Monotonic |
| 🔥 Information Technology | +0.524 | +2.58 | 100.0% | -28.54% | ✅ Monotonic |
| Real Estate | +0.124 | +0.84 | 74.4% | -3.83% | ✅ |
| Utilities | +0.199 | +1.01 | 76.9% | -0.63% | ✅ |
IT Sector: An Extreme Case of Momentum
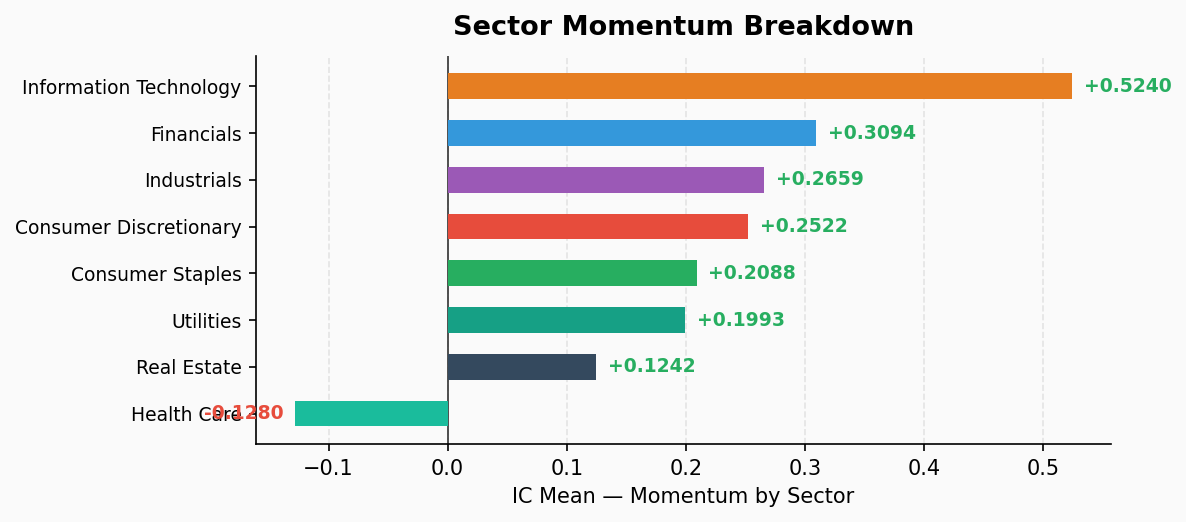
IT sector momentum IC reaches +0.524 with a long-short spread of -28.54%. Q5 (strongest momentum) averaged +27.2% over 21 days, Q4 +15.9%, Q3 +13.6% — winner takes all. IT momentum is experiencing an extreme positive concentration effect. Long IT winners remains the clearest alpha source.
Health Care: The Lone Reversal Signal
Health Care is the only sector where momentum fails, with IC -0.128 and IC>0 rate of just 15.4%. Q1 (weakest momentum) averaged +4.84% while Q5 was -2.66%, producing a long-short spread of +7.51%. The healthcare sector continues to experience significant style rotation — previously beaten-down stocks are rebounding sharply while former leaders face selling pressure.
Financials and Industrials: Steady Contributors
Financials (IC +0.309) and Industrials (IC +0.266) show stable momentum effects with good monotonicity, making them the most attractive momentum exposure sectors after IT.
4. Anomaly Detection
✅ All factors within normal fluctuation range. No anomaly alerts.
5. Strategy Implications
- Overweight momentum in IT and Financials: Both have 100% positive IC probability with large and monotonic long-short spreads.
- Avoid value factors for now: EP, FCF_Yield, and ROE are all negative IC — value strategies continue to bleed.
- Consider contrarian plays in Health Care: The momentum reversal signal is clear; watch for oversold bounce opportunities.
- Large-cap growth style persists: Both size and vol factors point to large-cap, high-volatility growth stock dominance.
- Watch IT momentum crowding: IT sector Q5 returns at 27% are extremely elevated — monitor momentum crash risk.