Factor Lab Daily Brief 2026-07-19
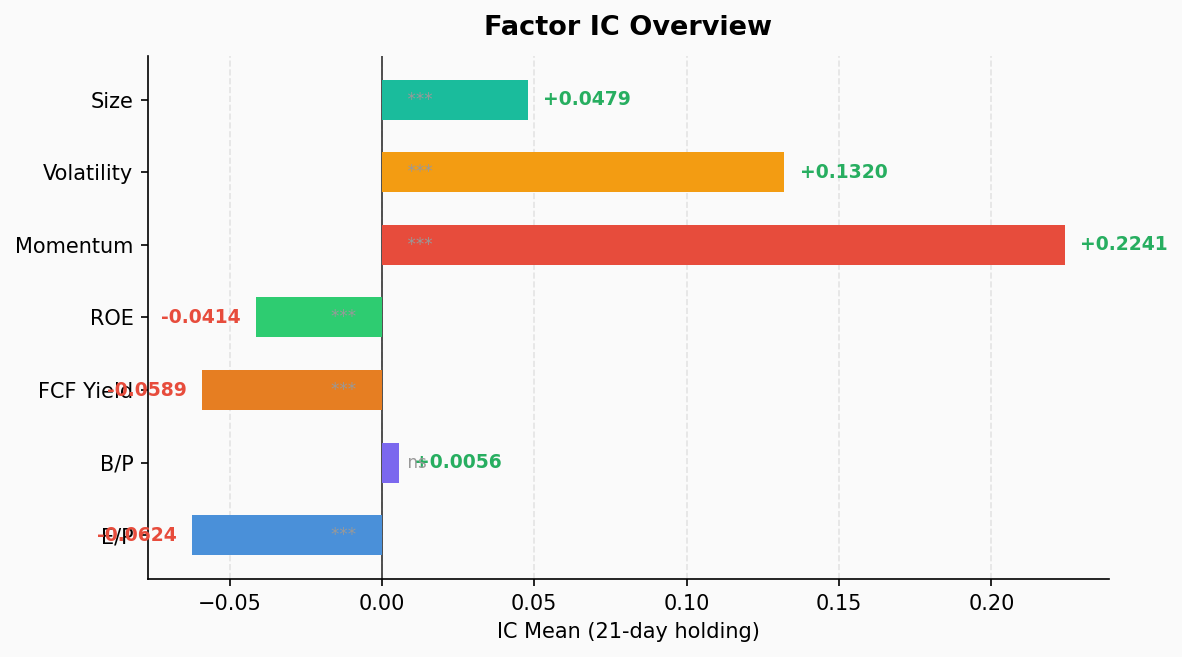
July 19 factor performance: Momentum continues its reign with IC mean +0.224 and ICIR +2.70, hitting 100% positive cross-sections. Info Tech sector momentum IC reaches +0.524 with Q5 monthly return of +27.2%. Value factors fail across the board — EP, FCF, and ROE all show significantly negative IC. Volatility and Size factors remain robustly positive.
All-Factor IC Test (21-Day Holding Period)
Today’s test covers 503 valid S&P 500 constituents across 7 factors over 39 cross-sectional periods.
📊 Factor Rankings (by |ICIR|)
| Factor | IC Mean | ICIR | t-stat | p-value | IC+ Pct | Long-Short |
|---|---|---|---|---|---|---|
| Momentum | +0.2241 | +2.70 ⭐ | +16.62 | 0.0000 | 100.0% | -8.07% |
| FCF Yield | -0.0589 | -1.43 ⭐ | -8.79 | 0.0000 | 7.7% | +3.04% |
| Size | +0.0479 | +1.25 ⭐ | +7.70 | 0.0000 | 87.2% | -2.06% |
| ROE | -0.0414 | -1.23 ⭐ | -7.58 | 0.0000 | 12.8% | +1.11% |
| Volatility | +0.1320 | +1.05 ⭐ | +6.48 | 0.0000 | 79.5% | -7.61% |
| EP | -0.0624 | -0.74 ⭐ | -4.57 | 0.0001 | 17.9% | +3.87% |
| Book/Price | +0.0056 | +0.08 | +0.48 | 0.6355 | 46.2% | +0.82% |
⭐ = Passes significance threshold (ICIR > 0.5 and p < 0.05)
🔥 Momentum: Absolute Dominance
Momentum remains king with an IC mean of +0.2241, ICIR of +2.70, and a perfect 100% positive cross-section rate — meaning in every single one of the last 39 periods, high-momentum stocks outperformed low-momentum ones. Quintile returns are strictly monotonic: Q1 (lowest momentum) averaged -0.12% monthly vs Q5 (highest) at +7.95%, producing a long-short spread of -8.07%. Textbook momentum effect.
⚡ Volatility: High Vol = High Return
Volatility factor IC mean +0.132, ICIR +1.05, IC positive rate 79.5%. Q5 high-volatility stocks averaged +8.15% monthly vs Q1 low-vol at just +0.54%. The market’s risk appetite is extreme — capital is chasing volatility rather than avoiding it.
📏 Size: Large-Cap Premium Persists
Size factor IC mean +0.048, ICIR +1.25, IC positive rate 87.2%. Large caps (Q5) averaged +4.51% monthly vs small caps (Q1) at +2.45%, long-short spread -2.06%. Large-cap concentration in a bull market is a classic pattern.
📉 Value Factors: Complete Collapse
All three value-related factors are decisively negative:
- EP (Earnings Yield): IC mean -0.062. “Cheap” high-EP stocks underperform (Q1 +6.41% vs Q4 +0.61%, though Q5 rebounds to +2.54%, non-monotonic)
- FCF Yield: IC mean -0.059, ICIR -1.43, IC positive rate just 7.7%. Low-FCF-yield stocks consistently outperform
- ROE: IC mean -0.041, high-ROE stocks lag (Q1 +4.82% vs Q5 +3.71%, spread only +1.11%)
- BP (Book/Price): The only non-significant value factor, ICIR just +0.08, p=0.635, essentially random
The collective failure of value factors signals a market in classic “ignore valuations” mode — growth and momentum are the only pricing anchors that matter.
Sector Momentum Decomposition
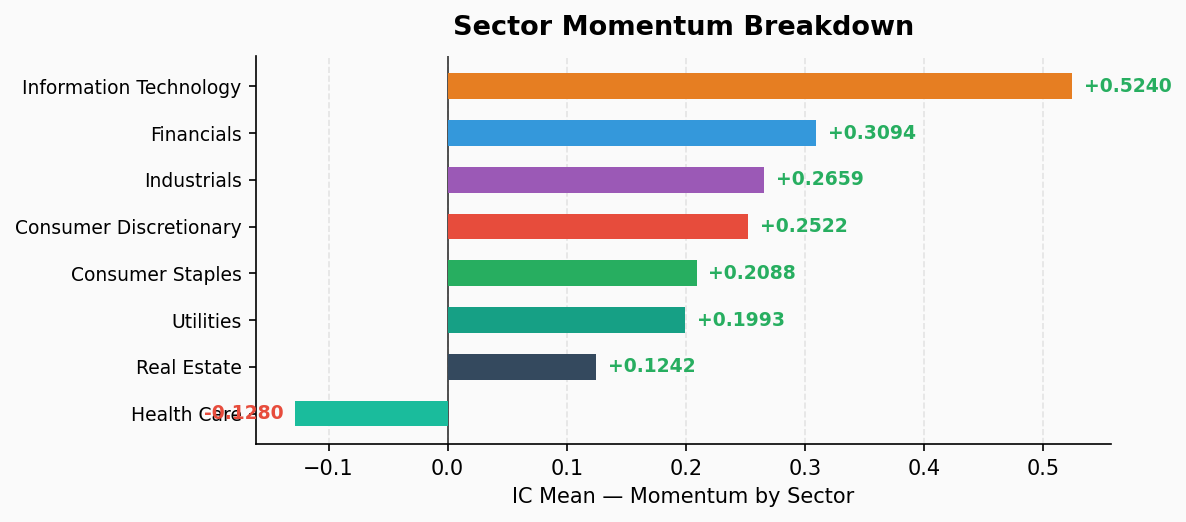
Of 11 GICS sectors, 3 were skipped due to insufficient constituents (<30): Communication Services (23), Energy (21), Materials (26). Results for the remaining 8:
| Sector | IC Mean | ICIR | t-stat | IC+ Pct | Q1 Mo. | Q5 Mo. | L-S Spread |
|---|---|---|---|---|---|---|---|
| Info Tech | +0.5240 | +2.58 | +15.93 | 100% | -1.35% | +27.19% | -28.54% |
| Financials | +0.3094 | +2.63 | +16.19 | 100% | +0.61% | +7.80% | -7.19% |
| Industrials | +0.2659 | +2.88 | +17.74 | 100% | -1.63% | +5.51% | -7.14% |
| Cons. Disc. | +0.2522 | +2.11 | +13.01 | 100% | -4.05% | +2.15% | -6.21% |
| Cons. Staples | +0.2088 | +1.34 | +8.27 | 87.2% | -4.65% | +0.02% | -4.67% |
| Utilities | +0.1993 | +1.01 | +6.20 | 76.9% | -2.29% | -1.66% | -0.63% |
| Real Estate | +0.1242 | +0.84 | +5.18 | 74.4% | +1.12% | +4.95% | -3.83% |
| Health Care | -0.1280 | -1.21 | -7.43 | 15.4% | +4.84% | -2.66% | +7.51% |
🔑 Key Findings
Info Tech: The Momentum King. IC mean +0.524, far exceeding all other sectors. Q5 high-momentum tech stocks averaged +27.2% monthly vs Q1 at -1.35%, producing a staggering -28.5% long-short spread. Tech is experiencing extreme positive feedback — the more a stock has risen, the more it continues to rise. AI-related names are likely the core driver.
Health Care: The Lone Reversal. IC mean -0.128, the only sector with significantly negative momentum. High-momentum healthcare stocks (Q5) actually lost -2.66% monthly, while low-momentum (Q1) gained +4.84%. Healthcare shows strong mean-reversion characteristics — consistent with the recent pullback in weight-loss drugs, gene editing, and other hot themes.
Financials & Industrials: Steady Momentum. Both sectors boast ICIR above +2.6 with near-monotonic quintiles. Financials Q5 averaged +7.80%, Industrials Q5 +5.51%. Reliable momentum plays without the extremes seen in tech.
Utilities: Weak Momentum Signal. While IC is positive (+0.199), Q5 returns are actually negative (-1.66%), quintiles are non-monotonic, and the long-short spread is a mere -0.63%. Momentum strategies are nearly useless in utilities.
Summary
The current US equity market displays a clear set of characteristics:
- Momentum is the only game in town — ICIR +2.70, 100% hit rate, unmatched
- Value factors are dead in the water — EP, FCF, ROE all significantly negative; the market doesn’t care about valuations
- High volatility is being rewarded — positive vol IC means capital is chasing risk, not avoiding it
- Large-cap premium persists — positive size factor reflects ongoing concentration in mega-caps
- Extreme sector divergence — Tech momentum IC +0.524 vs Healthcare -0.128, a 65bp gap in momentum efficacy
Strategic implications: The current environment strongly favors momentum strategies, particularly trend-following in Info Tech and Industrials. Value investors need patience — wait for style rotation signals. Healthcare’s mean-reversion profile warrants attention for potential contrarian positioning.
Factor Lab v2.0 | Data based on S&P 500 constituents | 21-day holding | 39 cross-sections