Factor Lab Daily Report 2026-07-18
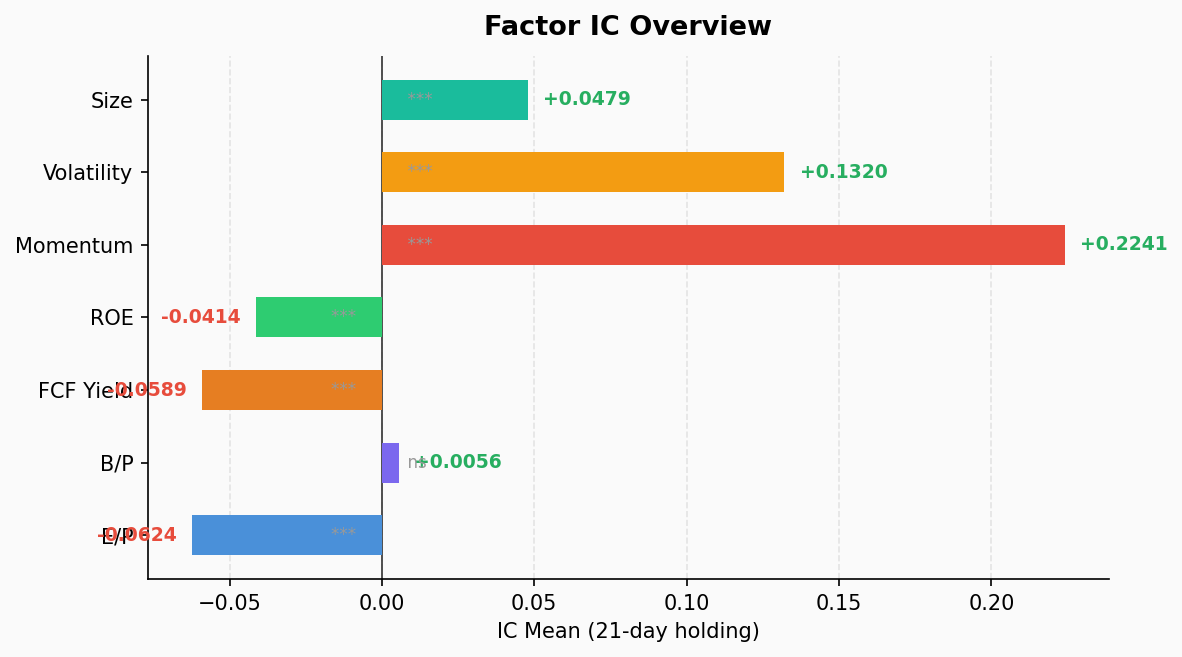
Momentum dominates with IC 0.224 and 100% positive cross-section. Value factors all negative IC — deep growth-style market. Healthcare shows momentum reversal.
Summary
- Momentum (mom): IC mean +0.224, ICIR 2.70, 100% positive cross-section, Q5 monthly return 7.95% — exceptionally strong
- Volatility (vol): IC mean +0.132, ICIR 1.05, high vol = high return — classic speculative market trait
- Value factors all fail: EP (-0.062), FCF Yield (-0.059), BP (+0.006) — all negative or near-zero
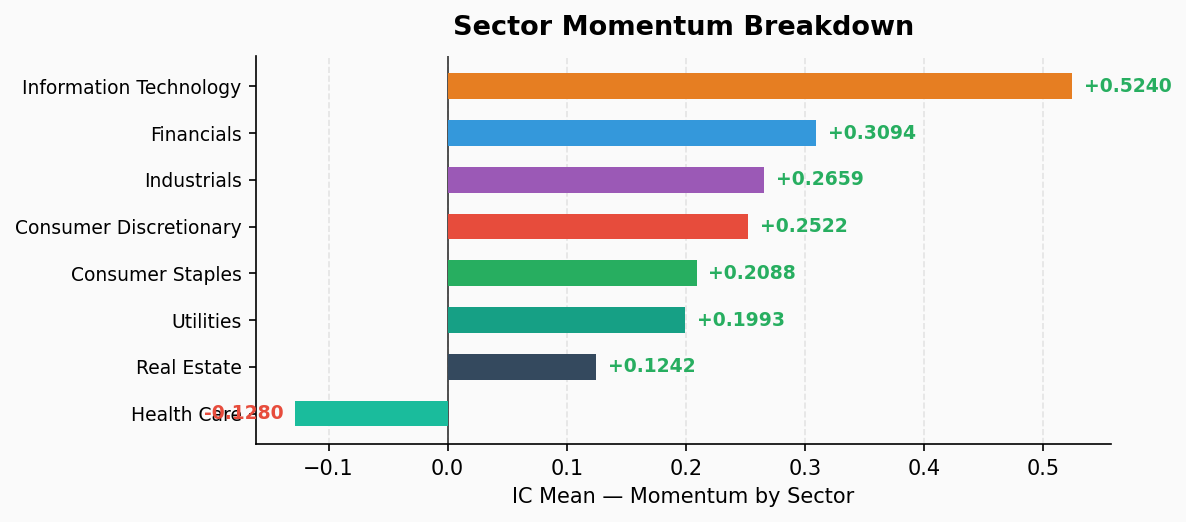
- Healthcare momentum reversal: IC -0.128 — winners reversing, losers rebounding
- Tech is momentum’s playground: IT sector momentum IC 0.524, Q5 return 27.2%
Full Factor IC Test
| Factor | IC Mean | ICIR | t-stat | p-value | IC Pos% | L/S Ret% | Status |
|---|---|---|---|---|---|---|---|
| mom | +0.224 | 2.70 | 16.62 | 0.000 | 100.0% | -8.07 | ⭐ Strong |
| vol | +0.132 | 1.05 | 6.48 | 0.000 | 79.5% | -7.61 | ⭐ Effective |
| size | +0.048 | 1.25 | 7.70 | 0.000 | 87.2% | -2.06 | ⭐ Effective |
| fcf_yield | -0.059 | -1.43 | -8.79 | 0.000 | 7.7% | +3.04 | ⚠️ Reversed |
| roe | -0.041 | -1.23 | -7.58 | 0.000 | 12.8% | +1.11 | ⚠️ Reversed |
| ep | -0.062 | -0.74 | -4.57 | 0.000 | 17.9% | +3.87 | ⚠️ Reversed |
| bp | +0.006 | 0.08 | 0.48 | 0.635 | 46.2% | +0.82 | ❌ Invalid |
⭐ = Passes significance/effectiveness threshold. IC Pos% = cross-sectional % where high-factor stocks outperform low-factor stocks.
Quintile Return Decomposition
Momentum is the only factor with perfect monotonicity — Q1 to Q5 returns increase step by step from -0.12% to +7.95%. Textbook-level effective factor.
Volatility shows an anomalous pattern: high-vol stocks earn the highest returns (Q5 8.15%). In normal markets, low-vol premium dominates. The current market exhibits “speculative risk appetite” — capital chasing high-beta names.
The value trio (EP, FCF Yield, BP) all negative IC: cheap stocks consistently underperform. FCF Yield’s positive cross-section ratio is only 7.7%, meaning value works almost never. This is a deep growth-style market.
ROE’s negative IC is notable: high-profitability companies underperform, suggesting the market rewards “storytelling” over “earning real money.”
Sector Momentum Decomposition
| Sector | IC Mean | ICIR | Q1 Ret | Q5 Ret | L/S Ret | Direction |
|---|---|---|---|---|---|---|
| Info Tech | +0.524 | 2.58 | -1.35% | +27.19% | -28.54% | 🔥 Extreme |
| Financials | +0.309 | 2.63 | +0.61% | +7.80% | -7.19% | 🔥 Strong |
| Industrials | +0.266 | 2.88 | -1.63% | +5.51% | -7.14% | 🔥 Strong |
| Cons. Disc. | +0.252 | 2.11 | -4.05% | +2.15% | -6.21% | ✅ Effective |
| Cons. Staples | +0.209 | 1.34 | -4.65% | +0.02% | -4.67% | ✅ Effective |
| Utilities | +0.199 | 1.01 | -2.29% | -1.66% | -0.63% | ✅ Effective |
| Real Estate | +0.124 | 0.84 | +1.12% | +4.95% | -3.83% | ⚠️ Weak |
| Health Care | -0.128 | -1.21 | +4.84% | -2.66% | +7.51% | 🔴 Reversal |
Key Findings
Tech sector momentum is overwhelming. IC mean 0.524, Q5 return 27.2%, Q3-Q4-Q5 returns from 13.6% → 15.9% → 27.2%. High-momentum tech stocks are in an almost “can’t lose” state. But this extreme level warrants caution: is momentum crowding too high?
Healthcare is the sole momentum-reversal sector. IC -0.128 — past winners are being sold, losers rebounding. This may relate to policy uncertainty (IRA drug price negotiations) and rotation from defense to offense.
Financials and Industrials show robust momentum. Both have ICIR above 2.5 with good Q1-to-Q5 monotonicity — prime hunting grounds for momentum strategies.
Strategy Implications
Momentum is the only factor worth overweighting right now. ICIR 2.70, 100% positive cross-section, perfect monotonicity — all three metrics at full score simultaneously, extremely rare.
Stay away from value traps. EP, FCF Yield all negative IC. Buying cheap stocks is catching falling knives. This isn’t “temporary underperformance” — it’s systematic negative premium.
Volatility’s anomalous signal — high vol outperforming low vol — typically appears in liquidity-rich, high-retail-participation market phases. If this pattern persists, it signals extreme optimism and warrants reversal vigilance.
Momentum at sector level: Tech > Financials ≈ Industrials > Consumer Discretionary > Others. Avoid momentum strategies in Healthcare.
Risk alert: Momentum IC of 0.224 is abnormally high — historical mean is ~0.08-0.12. Extreme factor premiums often come with mean-reversion risk.
Data: Factor Lab v2.0 panel data · 503 US stocks · 39 cross-sections · 21-day holding period Generated: 2026-07-18 06:52 CST