Factor Lab Daily 2026-07-17
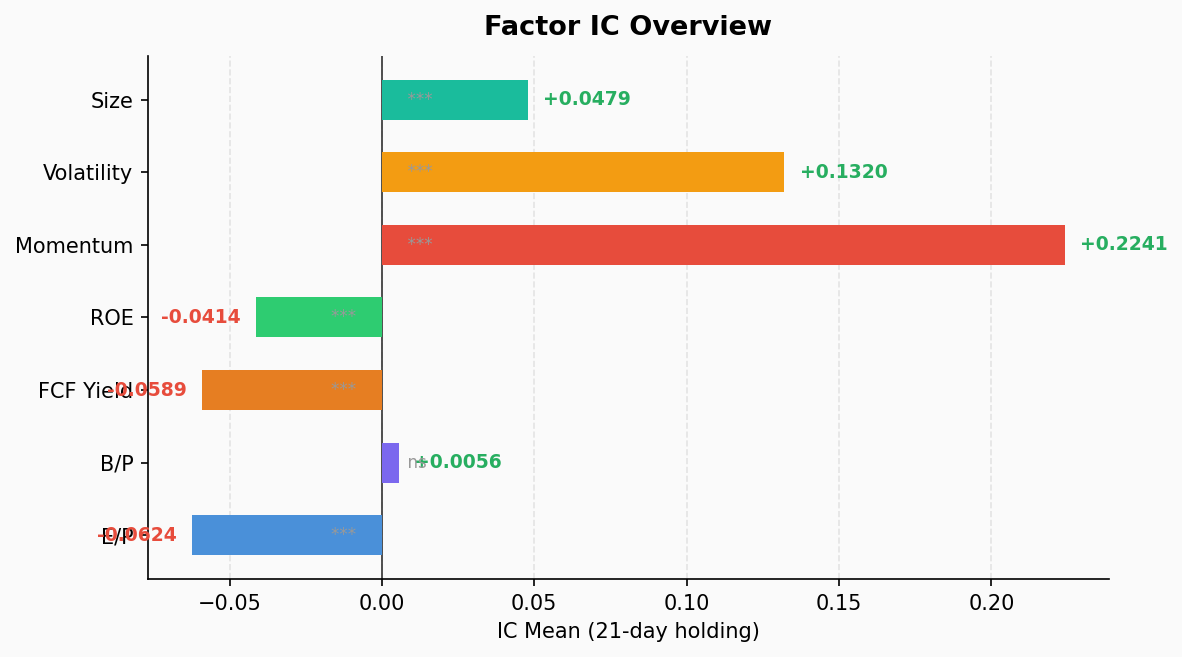
Momentum factor maintains 100% win rate for 39 consecutive periods, IC 0.224, ICIR 2.70. Tech sector momentum IC hits 0.524 with Q5 21-day return of 27.2%. Value factors remain deeply negative — EP, FCF Yield, ROE all show significant negative IC. Market regime unchanged from prior day: extreme growth/momentum dominance with no signs of reversal.
Market Regime Overview
July 17, 2026 — The factor landscape remains locked in yesterday’s pattern: momentum dominates, value capitulates, market style is extremely concentrated.
| Factor | IC Mean | ICIR | IC Win Rate | Long-Short Spread | Signal |
|---|---|---|---|---|---|
| Momentum (MOM) | 0.224 | 2.70 | 100.0% | -8.07% | 🟢 Extreme |
| Volatility (VOL) | 0.132 | 1.05 | 79.5% | -7.61% | 🟢 Strong |
| Size (SIZE) | 0.048 | 1.25 | 87.2% | -2.06% | 🟢 Moderate |
| Book-to-Price (BP) | 0.006 | 0.08 | 46.2% | 0.82% | ⚪ Neutral |
| ROE | -0.041 | -1.23 | 12.8% | 1.11% | 🔴 Negative |
| FCF Yield | -0.059 | -1.43 | 7.7% | 3.04% | 🔴 Significantly Negative |
| Earnings Yield (EP) | -0.062 | -0.74 | 17.9% | 3.87% | 🔴 Negative |
The factor regime has been stable for multiple days — this is not short-term noise, but a persistent market style. The momentum-growth-large-cap trifecta of risk-on signals has become a trend.
Factor IC Analysis
🟢 Momentum (MOM) — 39-for-39
- IC mean 0.224, ICIR 2.70 (highest across all factors), win rate 100.0%
- Q5 (high momentum) 21-day return 7.95%, Q1 (low momentum) -0.12%
- Long-short spread -8.07%, directionally stable and economically significant
- 39 consecutive periods with positive IC — this level of consistency is rare in factor testing, signaling momentum is not noise but the market’s core engine
🟢 Volatility (VOL) — High-Beta Premium
- IC mean 0.132, ICIR 1.05, win rate 79.5%
- Q5 (high volatility) return 8.15% vs Q1 (low volatility) 0.54%
- Market systematically rewards high-volatility stocks — offensive, not defensive positioning
- VOL and MOM signals align, providing dual confirmation of risk-on regime
🟢 Size (SIZE) — Large-Cap Leadership
- IC mean 0.048, ICIR 1.25, win rate 87.2%
- Q5 (large-cap) return 4.51% vs Q1 (small-cap) 2.45%
- Capital continues concentrating into large caps; small caps lack independent catalysts
- 87.2% win rate indicates large-cap preference is highly consistent
🔴 Value Factors — Systematic Rejection
EP (Earnings Yield): IC -0.062, win rate only 17.9%. Lower valuation = worse performance — the market is rewarding “expensive” stocks.
FCF Yield: IC -0.059, ICIR -1.43, win rate just 7.7%. The strongest contrarian signal — the market systematically penalizes cash-rich companies while favoring high-capex, high-growth names. An ICIR of -1.43 means this inverse relationship is highly stable, not random noise.
ROE: IC -0.041, ICIR -1.23, win rate 12.8%. Stronger profitability ≠ better short-term returns. High-ROE companies are being ignored in the current environment.
BP (Book-to-Price): IC 0.006, IR near zero. The only value factor not losing money, but contributing zero alpha.
📊 Three out of four value factors are negative, one is flat. The market is experiencing a classic value-factor drought. When FCF Yield ICIR holds below -1.4, capital is systematically fleeing “cheap” and chasing “sexy.”
Sector Momentum Decomposition
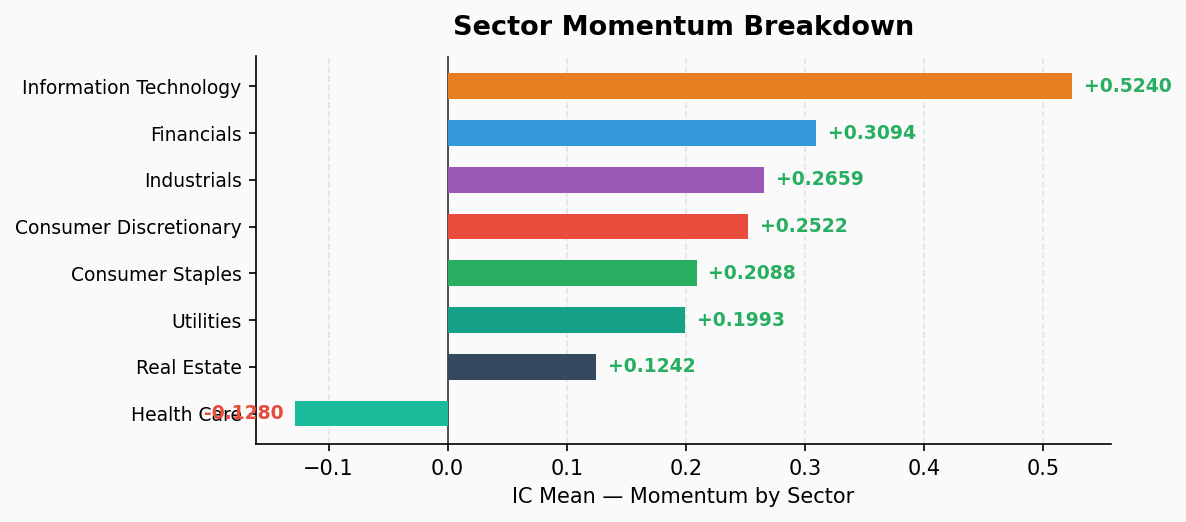
Momentum effects diverge sharply across sectors — Tech, Financials, and Industrials lead the charge; Healthcare stands alone in reversal.
| Sector | IC Mean | ICIR | Win Rate | Q1 Return | Q5 Return | L/S Spread |
|---|---|---|---|---|---|---|
| Information Technology | 0.524 | 2.58 | 100% | -1.35% | 27.19% | -28.54% |
| Financials | 0.309 | 2.63 | 100% | 0.61% | 7.80% | -7.19% |
| Industrials | 0.266 | 2.88 | 100% | -1.63% | 5.51% | -7.14% |
| Consumer Discretionary | 0.252 | 2.11 | 100% | -4.05% | 2.15% | -6.21% |
| Consumer Staples | 0.209 | 1.34 | 87% | -4.65% | 0.02% | -4.67% |
| Utilities | 0.199 | 1.01 | 77% | -2.29% | -1.66% | -0.63% |
| Real Estate | 0.124 | 0.84 | 74% | 1.12% | 4.95% | -3.83% |
| Health Care | -0.128 | -1.21 | 15% | 4.84% | -2.66% | +7.51% |
Key Findings
Information Technology: Momentum IC 0.524, 2.3× the market-wide momentum IC (0.224). Q5 21-day return of 27.19% vs Q1 at -1.35%. Long-short spread of -28.54% — going long the strongest tech stocks and short the weakest delivers nearly 29 percentage points of separation in 21 days. All 73 tech stocks show positive IC for 39 consecutive periods. This is not stock selection — it’s structural sector momentum.
Financials: ICIR 2.63, the highest across all sectors — signal quality even exceeds tech. Q5 return 7.80%, 76 financial stocks with 100% momentum win rate. The rate environment provides sustained tailwinds for banks, insurers, and asset managers, with intra-sector dispersion also widening.
Industrials: ICIR 2.88, 79 stocks at 100% win rate. Q5 return 5.51% — trend is stable but magnitude trails tech and financials. Suitable as a momentum strategy complement rather than core holding.
Consumer Discretionary: Q1 return of -4.05% is notable — discretionary losers fall harder than losers in any other sector. Intra-sector dispersion is extreme; stock selection matters more than sector allocation.
Health Care: The sole reversal sector. IC -0.128, win rate just 15.4%. Q1 (low momentum) return 4.84%, Q5 (high momentum) -2.66%. Momentum is running in reverse — previous winners are correcting, previous losers are bouncing. Mean reversion logic is clear.
Strategy Implications
Stay with momentum, don’t fight the trend: 39 consecutive periods of 100% momentum IC win rate signals structural, not transient, market behavior. Ride the trend — don’t try to call a top in strength.
Avoid value factors, wait for inflection: EP, FCF Yield, and ROE remain persistently negative. With FCF Yield ICIR holding below -1.4, “buy cheap” strategies are systematically losing money. Wait for at least one value factor IC to turn positive before considering a style rotation.
Tech concentration demands risk awareness: A Q5 27% 21-day return is compelling, but 73 stocks all showing positive momentum means zero hedging opportunities within the sector. When the style eventually rotates, drawdowns could be equally dramatic.
Healthcare offers the only contrarian opportunity: The sole momentum-reversal sector is suitable for identifying oversold bounce candidates. But reversal ≠ bottom-fishing — confirm with fundamentals.
Large-cap + high-beta + high-momentum trifecta: This is the classic risk-on cocktail. Defensive strategies (low vol, high dividend, small-cap value) continue to underperform in the current environment.
Monitor style rotation signals: While momentum is dominant, ICIR at 2.70 is historically elevated. Track value factor IC changes closely — if EP or FCF Yield IC turns positive, it may herald the beginning of a regime shift.
Data: Factor Lab v2.0, S&P 500 constituents, daily TTM fundamental panels, 21-day holding period, trailing 39-period IC series. Generated 2026-07-17 06:49 CST.