Factor Lab Daily Brief 2026-07-15
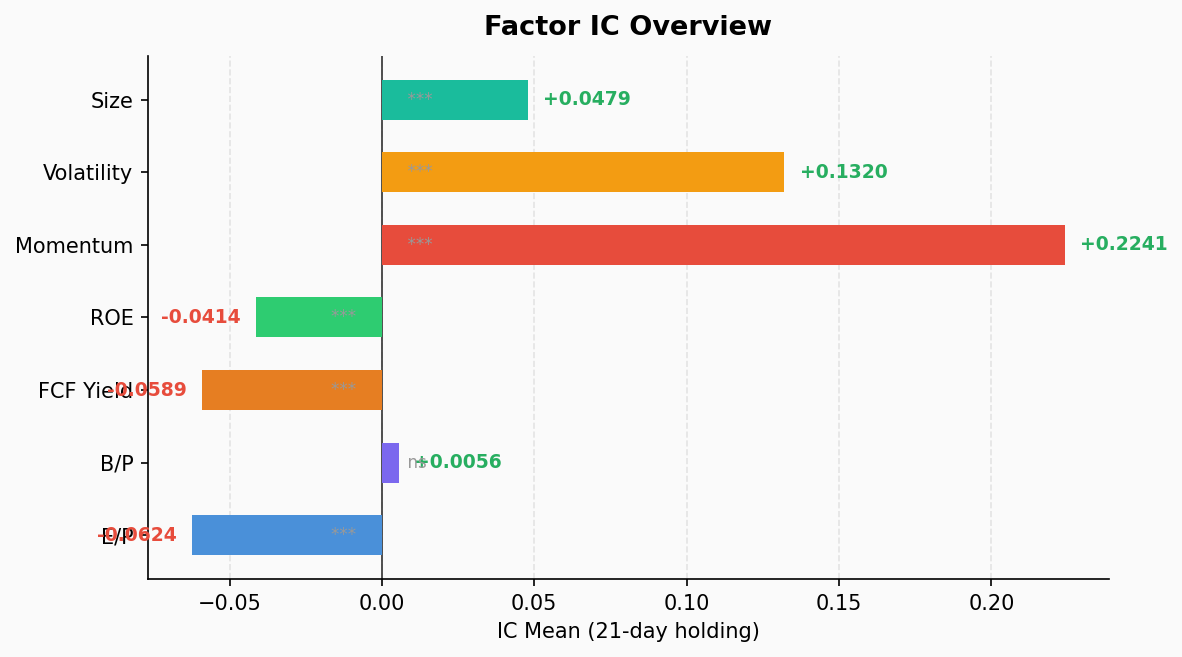
Momentum continues its total dominance with IC mean 0.224, ICIR 2.70, 100% positive hit rate; value factors bleed across the board. Tech sector momentum IC hits 0.524.
Full Factor IC Analysis
| Factor | IC Mean | ICIR | t-stat | p-value | IC Pos% | Q1 Ret | Q5 Ret | L/S (Q1-Q5) |
|---|---|---|---|---|---|---|---|---|
| EP (Earnings Yield) | -0.062 | -0.74 | -4.57 | 0.00005 | 17.9% | +6.41% | +2.54% | +3.87% |
| BP (Book-to-Price) | +0.006 | +0.08 | +0.48 | 0.635 | 46.2% | +3.88% | +3.06% | +0.82% |
| FCF Yield | -0.059 | -1.43 | -8.79 | 0.0 | 7.7% | +5.64% | +2.60% | +3.04% |
| ROE | -0.041 | -1.23 | -7.58 | 0.0 | 12.8% | +4.82% | +3.71% | +1.11% |
| MOM (Momentum) | +0.224 | +2.70 | +16.62 | 0.0 | 100.0% | -0.12% | +7.95% | -8.07% |
| VOL (Volatility) | +0.132 | +1.05 | +6.48 | 0.0 | 79.5% | +0.54% | +8.15% | -7.61% |
| SIZE (Market Cap) | +0.048 | +1.25 | +7.70 | 0.0 | 87.2% | +2.45% | +4.51% | -2.06% |
Key Findings
Momentum rules everything. The MOM factor posts an IC mean of 0.224, ICIR of 2.70, and a perfect 100% positive IC hit rate — every single one of the past 39 weeks showed positive cross-sectional rank correlation. This is an exceptionally rare clean sweep. Q5 (strongest momentum) averaged +7.95% holding-period return versus -0.12% for Q1 (weakest), a spread exceeding 8 percentage points. The market is pricing “trend” at an extreme premium.
Value factors bleeding out. EP, FCF Yield, and ROE all show significantly negative ICs with ICIRs of -0.74, -1.43, and -1.23 respectively. High-earnings, high-cash-flow, high-ROE “cheap quality” stocks have consistently underperformed their high-valuation, low-quality counterparts over the past 39 weeks. BP (book-to-price) is technically positive but its 0.08 ICIR is statistical noise.
High vol + large cap = the winning combination. VOL factor IC mean +0.132, ICIR 1.05 — high-volatility stocks significantly outperform low-vol. SIZE factor IC +0.048, ICIR 1.25 — large caps beat small caps. Combined with momentum, the market’s pricing logic is crystal clear: buy expensive, buy winners, buy big, buy volatile. This is the classic factor profile of a risk-on expansion phase.
Style verdict: Growth crushing Value, Momentum crushing Mean Reversion. As long as this factor structure holds, trend-following beats dip-buying.
Sector Momentum Decomposition
| Sector | IC Mean | ICIR | IC Pos% | Q1 Ret | Q5 Ret | L/S (Q1-Q5) |
|---|---|---|---|---|---|---|
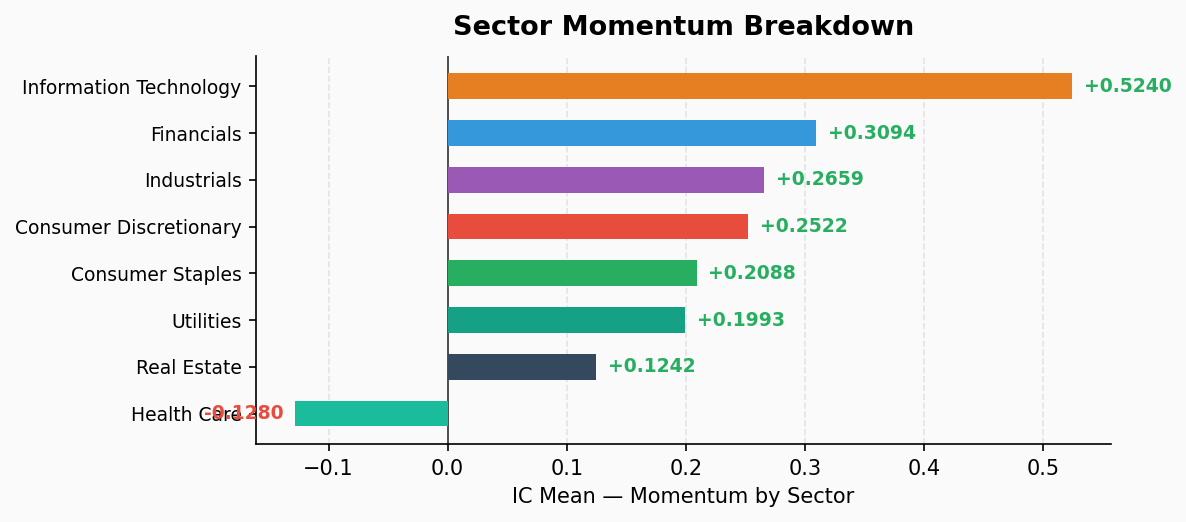
| Info Tech | +0.524 | +2.58 | 100.0% | -1.35% | +27.19% | -28.54% |
| Financials | +0.309 | +2.63 | 100.0% | +0.61% | +7.80% | -7.19% |
| Industrials | +0.266 | +2.88 | 100.0% | -1.63% | +5.51% | -7.14% |
| Cons. Discretionary | +0.252 | +2.11 | 100.0% | -4.05% | +2.15% | -6.21% |
| Cons. Staples | +0.209 | +1.34 | 87.2% | -4.65% | +0.02% | -4.67% |
| Utilities | +0.199 | +1.01 | 76.9% | -2.29% | -1.66% | -0.63% |
| Real Estate | +0.124 | +0.84 | 74.4% | +1.12% | +4.95% | -3.83% |
| Health Care | -0.128 | -1.21 | 15.4% | +4.84% | -2.66% | +7.51% |
Sector Findings
Tech momentum is in a league of its own. Information Technology’s IC mean of 0.524 is more than double the next-best sector. Q5 winners averaged +27.19% while Q1 losers posted -1.35%, a spread of 28.54 percentage points. This isn’t just “momentum works” — this is momentum dominating. Tech trend persistence is exceptionally strong.
Health Care is the sole reversal island. IC mean -0.128 with only 15.4% positive hit rate. Previously beaten-down Health Care stocks (Q1) actually gained +4.84%, while the strong names (Q5) lost -2.66%. This sector is running a mean-reversion logic completely opposite to the rest of the market. Potential drivers: biotech/pharma M&A expectations, FDA catalyst events, or simply technical oversold bounces.
Financials and Industrials show solid momentum. Both sectors have ICIRs above 2.6 with 100% positive hit rates and Q5 returns of 5-8%. Financials are particularly noteworthy — even Q1 posted positive returns (+0.61%), meaning even the “weakest” financial momentum stocks didn’t lose money. The entire sector appears to be in an uptrend.
Defensive momentum fading. Consumer Staples and Utilities still show positive ICs, but Q5 returns are near zero or negative (Staples +0.02%, Utilities -1.66%). Momentum strategies in defensive sectors are approaching ineffectiveness.
Strategy Implications
- Trend-following over value investing. In an environment with 100% momentum IC hit rate, fading the trend means catching falling knives. Wait for structural signals of factor regime change before switching styles.
- Tech momentum offers the highest returns but is also the most crowded. An IC of 0.524 means extreme trend consensus, but the higher the consensus, the more violent the reversal. Tight stop-losses are essential.
- Health Care as a hedge. If you hold significant Tech/Financial momentum exposure, Health Care’s reversal characteristics provide a natural hedge — when momentum strategies draw down, Health Care may actually benefit.
- Watch for the value factor inflection point. EP and FCF Yield negative ICs have persisted for 39 weeks. Historically, value factor失效 of this magnitude rarely exceeds 12-18 months. While now is not the time to bottom-fish value, closely monitor when IC turns positive — that will be the early signal of a style rotation.
Data source: moomoo OpenD US equity full-market factor analysis | 21-day holding period | 39-week observation window