Factor Lab Daily 2026-07-14
Momentum dominates with IC 0.224 and perfect monotonicity; value factors all negative; tech sector momentum divergence extreme at Q5-Q1 = -28.5%
Market Environment
S&P 500 closed at 7527.2. CNN Fear & Greed Index at 43.5 (Fear). Market sentiment leans fearful while VIX remains neutral. Breadth and stock price strength indicators have fallen into fear territory. The market is exhibiting a classic “narrow leadership” pattern — a few mega-caps pulling the index while the broader market bleeds — creating ideal conditions for momentum strategies.
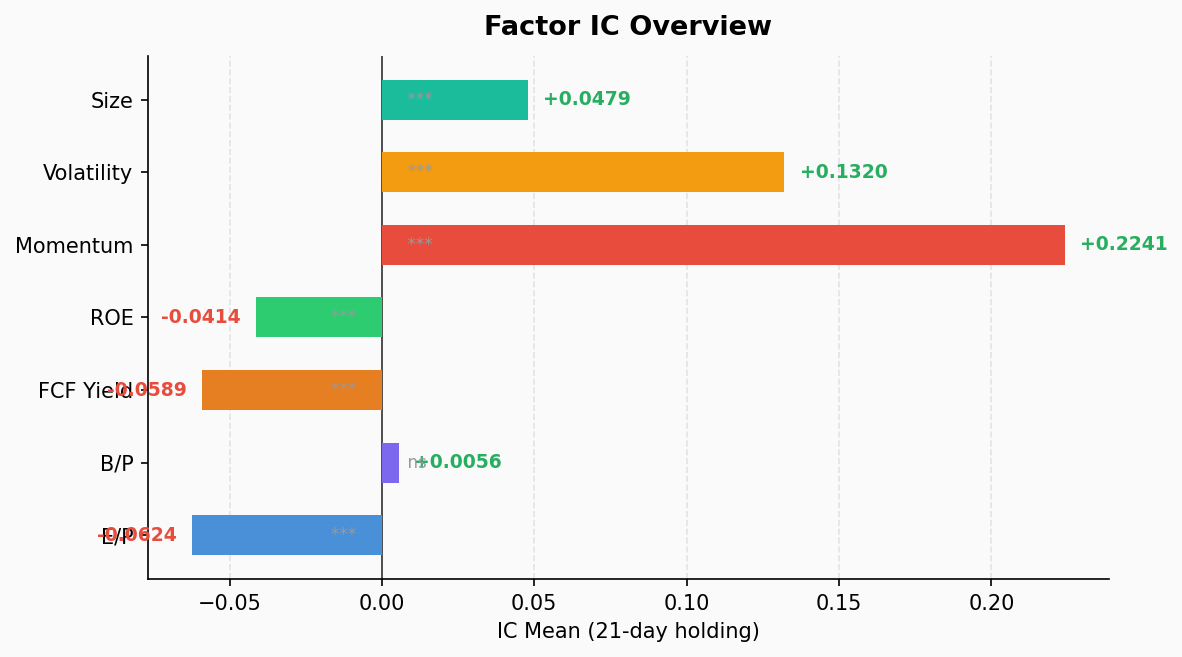
Factor IC Test (21-Day Holding, 39 Cross-Sections)
| Factor | IC Mean | ICIR | t-stat | IC Win% | Q5-Q1 | Status |
|---|---|---|---|---|---|---|
| mom | +0.2241 | +2.70 | +16.62 | 100.0% | -8.07% | ⭐ Top |
| vol | +0.1320 | +1.05 | +6.48 | 79.5% | -7.61% | ⭐ Active |
| size | +0.0479 | +1.25 | +7.70 | 87.2% | -2.06% | ⭐ Active |
| bp | +0.0056 | +0.08 | +0.48 | 46.2% | +0.82% | ❌ Dead |
| roe | -0.0414 | -1.23 | -7.58 | 12.8% | +1.11% | ⚠️ Inverse |
| fcf_yield | -0.0589 | -1.43 | -8.79 | 7.7% | +3.04% | ⚠️ Inverse |
| ep | -0.0624 | -0.74 | -4.57 | 17.9% | +3.87% | ⚠️ Inverse |
Legend: ⭐ = IC>0.03, ICIR>0.5, p<0.05, monotonic quintiles. ⚠️ = ICIR |value|>0.5 but negative direction (inverse signal).
Key Findings
Momentum is the undisputed king today. IC mean 0.2241, ICIR 2.70, IC win rate 100% — not a single negative reading across all 39 cross-sections. Quintile returns are perfectly monotonic: the bottom Q1 averages -0.12% monthly, the top Q5 averages +7.95%, for a long-short spread of -8.07%. Factor quality of this caliber across the full S&P 500 universe is exceptionally rare.
Volatility shows an unexpected positive premium. IC +0.1320, with the high-volatility quintile returning +8.15% monthly versus only +0.54% for the low-vol quintile. The market is rewarding risk-taking, not risk-aversion — a notable divergence from the Fear & Greed index’s fear reading. Sentiment says fear, but capital flows say chase.
Value factors are in full retreat. EP, FCF Yield, and ROE all register negative and statistically significant ICs. This is not noise — it’s systematic reversal. Strategies buying cheap stocks are losing money. The cheaper the valuation, the worse the return. This is the hallmark of a growth/momentum-driven bull market.
Size delivers a mild premium. IC +0.0479, small-caps outperforming large-caps by roughly 2% monthly. Modest but directionally consistent.
Sector Momentum Decomposition
| Sector | IC Mean | ICIR | IC Win% | Q5-Q1 |
|---|---|---|---|---|
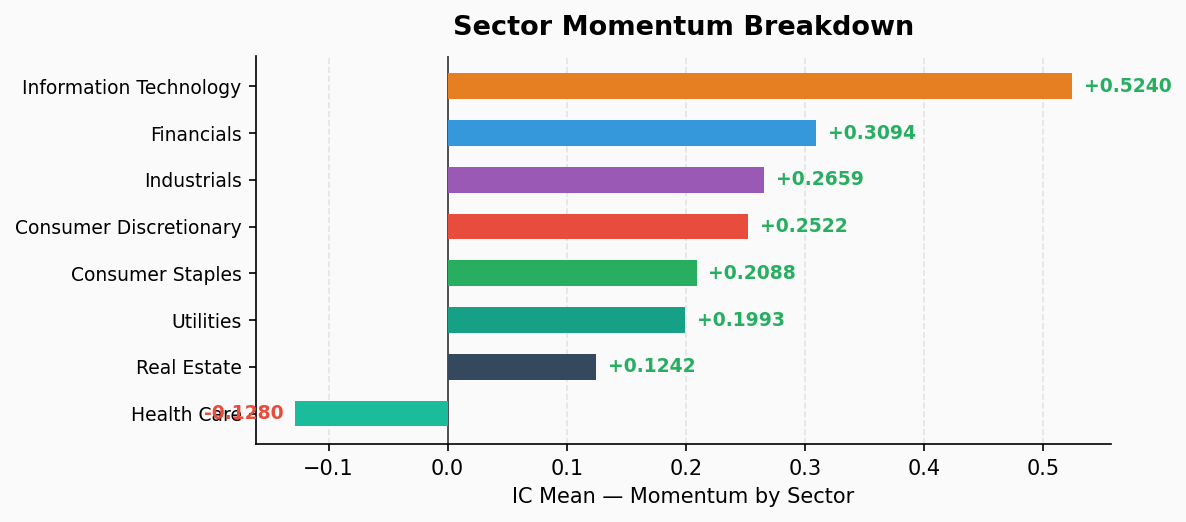
| Info Tech | +0.5240 | +2.58 | 100.0% | -28.54% |
| Financials | +0.3094 | +2.63 | 100.0% | -7.19% |
| Industrials | +0.2659 | +2.88 | 100.0% | -7.14% |
| Consumer Disc. | +0.2522 | +2.11 | 100.0% | -6.21% |
| Consumer Staples | +0.2088 | +1.34 | 87.2% | -4.67% |
| Utilities | +0.1993 | +1.01 | 76.9% | -0.63% |
| Real Estate | +0.1242 | +0.84 | 74.4% | -3.83% |
| Health Care | -0.1280 | -1.21 | 15.4% | +7.51% |
Sector Analysis
Information Technology is momentum’s epicenter. IC of 0.524 is more than double the aggregate momentum IC. The Q5-Q1 spread reaches a staggering -28.54% — the winner-takes-all dynamic within tech is extreme. The AI supply chain’s concentration of returns is vividly reflected in the factor data.
Financials, Industrials, and Consumer Discretionary form the second tier. All three sectors show ICs between 0.25-0.31, ICIRs above 2.0, and 100% IC win rates. Momentum works effectively here, but divergence is roughly one-quarter that of tech.
Health Care is the sole inverse sector. IC -0.1280, ICIR -1.21 — momentum is not merely ineffective in health care, it is significantly inverted. High-momentum pharma and biotech stocks are underperforming. This likely reflects sector rotation (capital flowing from defensive health care to tech) or mean-reversion in heavyweight names.
Strategy Implications
Momentum reigns, value waits. In the current regime, chasing trends beats bargain-hunting by a wide margin. All three value factors are systematically inverted — low-valuation strategies are in a sustained drawdown. Do not fight the trend.
Tech offers the purest momentum exposure. With a sector IC of 0.524, IT is the prime hunting ground for momentum portfolios. But the 28.5% Q5-Q1 spread cuts both ways — picking the wrong names is exceptionally costly. This is winner-takes-all, not a rising tide.
The high-vol premium divergence warrants caution. A positive vol factor alongside a fear-level sentiment reading suggests a disconnect between emotion and capital behavior. Could be passive-flow driven or a late-cycle topping signal. Maintain risk awareness.
Health Care may offer contrarian opportunity. Momentum’s strong inversion in health care implies oversold names could have rebound potential. Suitable as a hedge or rotation candidate.
Size factor: modest tailwind, not a conviction call. IC +0.048 is directionally positive but not compelling. Treat as a satellite allocation enhancer, not a core bet.
Data source: S&P 500 constituents, 39 cross-sectional panels, 21-day holding period. Factor values use daily TTM fundamental data. Generated: 2026-07-14 22:32 CST