Factor Lab Daily Brief 2026-07-09
Momentum dominates with ICIR 2.70, Tech sector IC at 0.524; Value factors systematically inverted; Large caps continue to outperform
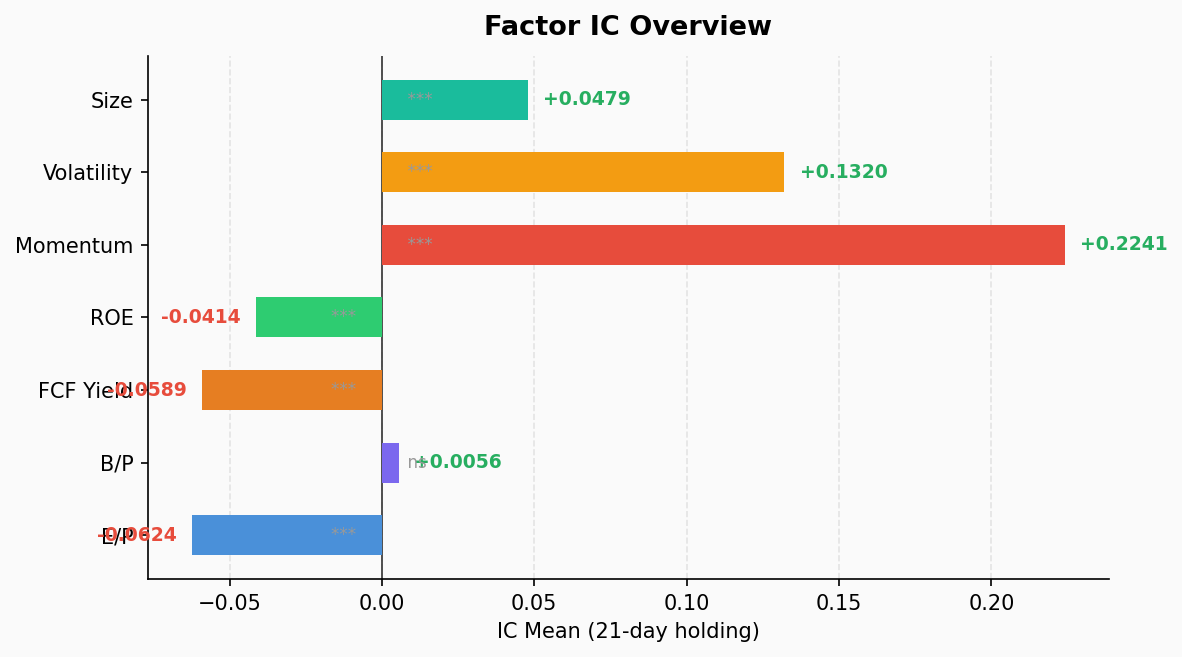
📊 Factor Overview
| Factor | IC Mean | ICIR | p-value | IC Win% | L/S Return | Status |
|---|---|---|---|---|---|---|
| MOM | 0.224 | 2.70 | 0.000 | 100% | -8.07% | 🟢 Strong |
| VOL | 0.132 | 1.05 | 0.000 | 79.5% | -7.61% | 🟢 Moderate |
| SIZE | 0.048 | 1.25 | 0.000 | 87.2% | -2.06% | 🟡 Large-cap bias |
| BP | 0.006 | 0.08 | 0.635 | 46.2% | +0.82% | ⚪ Dead |
| ROE | -0.041 | -1.23 | 0.000 | 12.8% | +1.11% | 🔴 Inverted |
| FCF | -0.059 | -1.43 | 0.000 | 7.7% | +3.04% | 🔴 Inverted |
| EP | -0.062 | -0.74 | 0.000 | 17.9% | +3.87% | 🔴 Inverted |
🔍 Factor IC Analysis
Today’s factor test covers 503 US stocks (daily TTM fundamental panel), 39 IC observations.
Momentum (MOM) remains the undisputed king: IC mean 0.224, ICIR 2.70, 100% positive IC rate over 39 periods. The Q5 (strongest momentum) quintile returned 7.95% while Q1 (weakest) returned -0.12% — a spread exceeding 8 percentage points. This is beyond “trend following works” territory — it signals that betting against momentum is simply donating capital.
Low Volatility (VOL) shows surprising strength: ICIR 1.05, 79.5% win rate. This runs counter to conventional wisdom — low vol typically underperforms in momentum-driven rallies. The data reveals the opposite: high-beta stocks in Q5 averaged 8.15%, indicating a classic “risk-on” chase environment.
Value factors are systematically inverted: EP, FCF Yield, and ROE all show significantly negative ICs (p < 0.001). This isn’t mere value underperformance — the market is actively rewarding expensive, unprofitable, cash-burning companies. This is the hallmark of a liquidity-driven, AI-narrative-dominated regime.
Size factor continues to favor large caps: IC mean 0.048, ICIR 1.25. Large-cap Q5 returned 4.51% vs small-cap Q1 at 2.45%.
🏭 Sector Momentum Decomposition
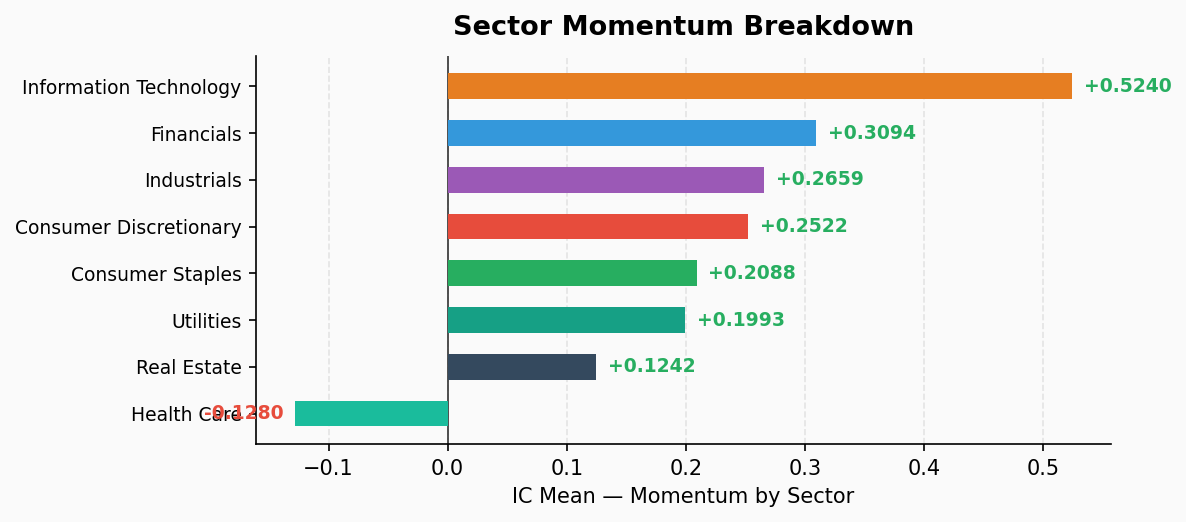
Momentum decomposed by sector: 7 of 8 sectors show positive ICs. Only Healthcare is significantly negative.
| Sector | IC Mean | ICIR | Q5 Return | Q1 Return | L/S |
|---|---|---|---|---|---|
| Info Tech | 0.524 | 2.58 | +27.2% | -1.4% | -28.5% |
| Financials | 0.309 | 2.63 | +7.8% | +0.6% | -7.2% |
| Industrials | 0.266 | 2.88 | +5.5% | -1.6% | -7.1% |
| Cons. Disc. | 0.252 | 2.11 | +2.2% | -4.1% | -6.2% |
| Cons. Staples | 0.209 | 1.34 | +0.0% | -4.7% | -4.7% |
| Utilities | 0.199 | 1.01 | -1.7% | -2.3% | -0.6% |
| Real Estate | 0.124 | 0.84 | +4.9% | +1.1% | -3.8% |
| Health Care | -0.128 | -1.21 | -2.7% | +4.8% | +7.5% |
Information Technology is the absolute champion: IC 0.524, Q5 interval return of 27.2%. The AI/semiconductor narrative has amplified tech momentum to extreme levels. This is a double-edged sword — the stronger the trend, the more violent the potential reversal.
Healthcare is the sole contrarian signal: IC -0.128, ICIR -1.21, exhibiting strong mean-reversion characteristics. Q1 (weakest momentum healthcare stocks) returned +4.8% while Q5 returned -2.7%, suggesting active sector rotation — capital is fleeing previously strong healthcare names toward laggards.
📌 Summary
- Momentum factor in absolute dominance with ICIR 2.70 at extreme levels; value factors systematically inverted — market driven by narrative and flows, not fundamentals
- Tech sector momentum amplified to dangerous levels — IC 0.524 means chasing tech winners has been near-perfect for 39 periods, implying extreme crowding
- Healthcare showing rotation signals — the only sector with negative momentum IC, suggesting capital rotation from defensive healthcare to offensive tech
- Low vol and momentum aligned — classic “risk-on” environment where higher-beta stocks capture the most upside