Factor Lab Daily Report 2026-07-08
Momentum dominance persists: ICIR 2.70/100% hit rate; all three value factors significantly inverted; Tech sector momentum IC reaches 0.524
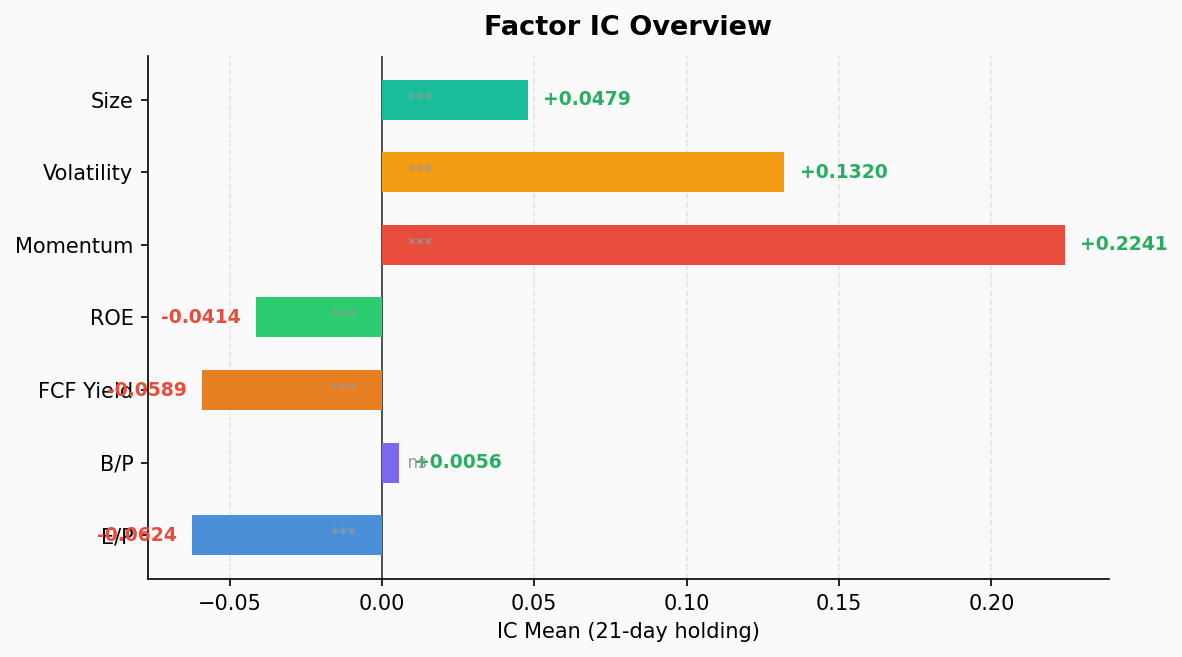
Factor IC Test (Market-Wide, 39 Rolling Periods)
| Factor | IC Mean | ICIR | t-stat | p-value | Positive % | Long-Short |
|---|---|---|---|---|---|---|
| Momentum | 0.224 | 2.70 | 16.6 | 0.000 | 100.0% | -8.07% |
| Volatility | 0.132 | 1.05 | 6.5 | 0.000 | 79.5% | -7.61% |
| Size | 0.048 | 1.25 | 7.7 | 0.000 | 87.2% | -2.06% |
| BP | 0.006 | 0.08 | 0.5 | 0.635 | 46.2% | +0.82% |
| ROE | -0.041 | -1.23 | -7.6 | 0.000 | 12.8% | +1.11% |
| FCF Yield | -0.059 | -1.43 | -8.8 | 0.000 | 7.7% | +3.04% |
| EP | -0.062 | -0.74 | -4.6 | 0.000 | 17.9% | +3.87% |
Positive IC = factor value positively correlated with future returns. Long-Short = Q1−Q5; negative means high-factor group outperforms.
Key Findings
Momentum dominance persists. Momentum ICIR 2.70, 100% positive hit rate over 39 rolling periods, long-short spread −8.07%. High-momentum Q5 averaged +7.95% vs Q1 at −0.12%. Momentum has not failed in a single rolling month.
Value factors fully inverted. EP (IC −0.062), FCF Yield (IC −0.059), and ROE (IC −0.041) all show significantly negative ICs. Cheap/high-quality stocks continue to underperform — a hallmark of momentum-driven markets where capital chases trends over fundamentals.
Low-vol anomaly reversed. Volatility IC +0.132 — high-vol stocks outperforming low-vol by +7.61%. The exact opposite of the traditional low-vol premium, signaling a return of risk appetite.
Large-cap preference established. Size IC +0.048, t-stat 7.7, 87.2% positive rate. Large caps consistently outperforming small caps, consistent with liquidity-concentrated markets.
BP factor neutral. Book-to-price IC near zero, not statistically significant. The only fundamental factor without a clear directional signal.
Sector Momentum Decomposition
| Sector | IC | ICIR | t-stat | Positive % | Long-Short |
|---|---|---|---|---|---|
| 🚀 Info Tech | 0.524 | 2.58 | 15.9 | 100% | −28.54% |
| 🏦 Financials | 0.309 | 2.63 | 16.2 | 100% | −7.19% |
| 🏭 Industrials | 0.266 | 2.88 | 17.7 | 100% | −7.14% |
| 🛒 Cons. Disc. | 0.252 | 2.11 | 13.0 | 100% | −6.21% |
| 🛍️ Cons. Staples | 0.209 | 1.34 | 8.3 | 87.2% | −4.67% |
| 🔌 Utilities | 0.199 | 1.01 | 6.2 | 76.9% | −0.63% |
| 🏠 Real Estate | 0.124 | 0.84 | 5.2 | 74.4% | −3.83% |
| 🏥 Health Care | −0.128 | −1.21 | −7.4 | 15.4% | +7.51% |
Sector Highlights
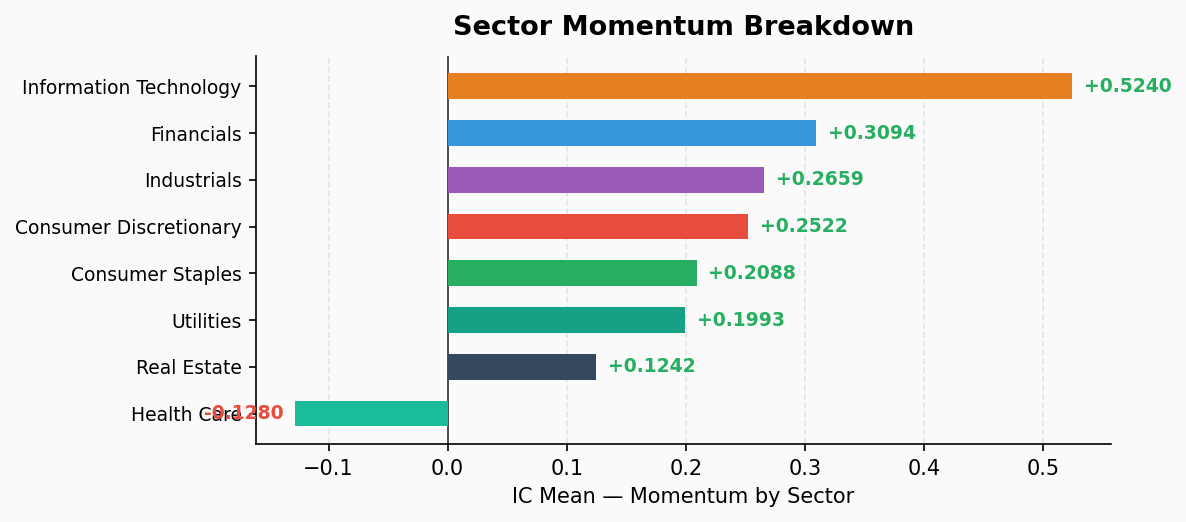
Tech in a league of its own. Info Tech IC 0.524, Q5 averaged +27.19%, long-short spread −28.54%. Momentum in tech is crushing — high-momentum tech stocks gained 27% on average over the period.
Health Care is the sole contrarian sector. IC −0.128 means low-momentum healthcare stocks outperform high-momentum ones. Classic mean-reversion signal — previously overextended healthcare names correcting while laggards rebound. Q1 (low momentum) +4.84%, Q5 (high momentum) −2.66%.
Financials and Industrials show robust momentum. Both with ICs in the 0.27–0.31 range, 100% positive hit rates, long-short spreads around −7%. Financials’ ICIR of 2.63 even edges out Tech in stability.
Utilities and Real Estate momentum weaker. ICs below 0.20, ICIRs under 1.0 — statistically significant but directionally weaker.
Overall Assessment
The market is in a classic momentum-driven, value-failing regime. Only momentum, volatility, and size show significant positive ICs among seven factors; three value/quality factors are significantly inverted. This structure typically appears in:
- Mid-to-late stage trending markets (momentum self-reinforcement)
- Abundant liquidity environments (capital chasing growth and trends)
- Fundamental factors temporarily suppressed by sentiment
At the sector level, Tech momentum is extreme (IC 0.524), while Health Care is the lone reversal signal — suggesting Tech may be approaching late-stage acceleration and Health Care is undergoing sector rotation.
⚠️ Risk note: 100% momentum hit rate is unsustainable. When it begins to crack, it often signals the start of a style rotation.