Factor Lab Daily Brief 2026-07-02
Momentum factor IC 0.224 with ICIR 2.70 dominates; IT sector momentum extreme (IC 0.52); value factors remain inverted
Factor Lab Daily Brief — 2026-07-02
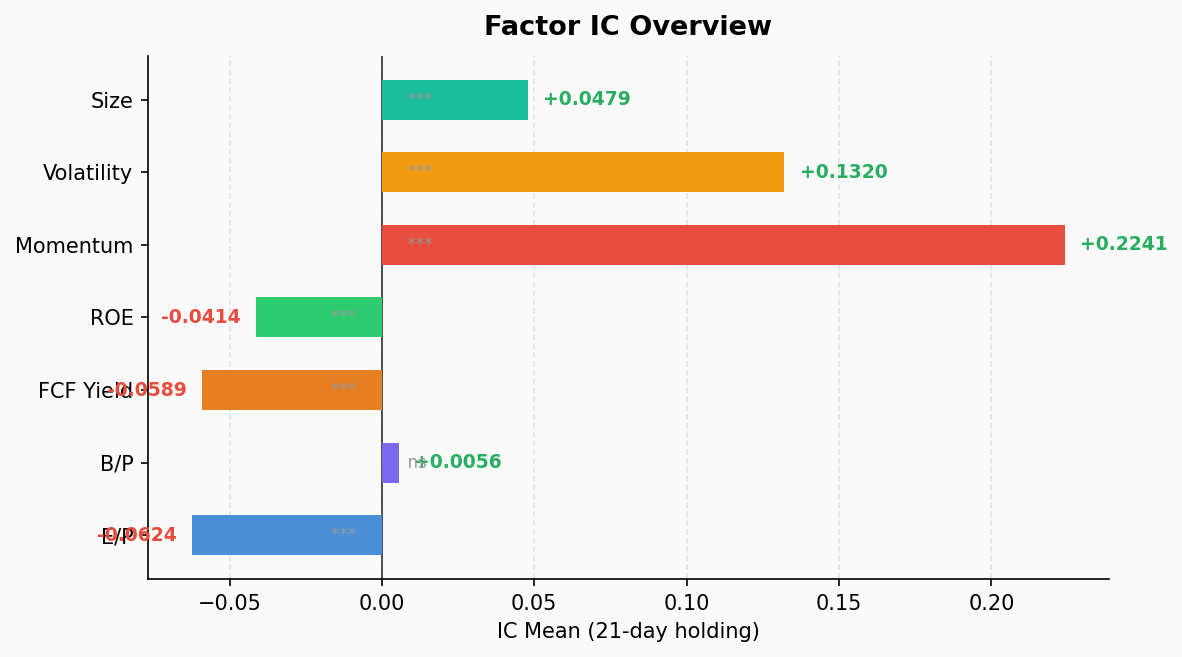
Factor IC Test Overview
Full 7-factor test on 503 S&P 500 constituents, 21-day holding period, 39 cross-sectional periods:
| Factor | IC Mean | ICIR | t-stat | p-value | IC+% | Long-Short | Rating |
|---|---|---|---|---|---|---|---|
| mom | +0.2241 | 2.6966 | 16.62 | 0.0000 | 100.0% | -8.07% ⭐ | 🟢 Excellent |
| size | +0.0479 | 1.2497 | 7.70 | 0.0000 | 87.2% | -2.06% | 🟢 Effective |
| vol | +0.1320 | 1.0508 | 6.48 | 0.0000 | 79.5% | -7.61% | 🟢 Effective |
| ep | -0.0624 | -0.7418 | -4.57 | 0.0001 | 17.9% | +3.87% | 🟡 Inverse |
| fcf_yield | -0.0589 | -1.4256 | -8.79 | 0.0000 | 7.7% | +3.04% | 🟡 Inverse |
| roe | -0.0414 | -1.2298 | -7.58 | 0.0000 | 12.8% | +1.11% | 🟡 Inverse |
| bp | +0.0056 | 0.0775 | 0.48 | 0.6355 | 46.2% | +0.82% | 🔴 Useless |
Key Findings:
- Momentum dominates: IC mean 0.224, ICIR ~2.70, 100% positive IC across all 39 periods. This is extraordinarily rare in academic research — past 12-month winners consistently continue outperforming over the next 21 days.
- Value factors all invert: EP, FCF, ROE all show negative IC, meaning low-PE/high-FCF stocks underperform. The market is aggressively rewarding growth and momentum over value.
- Book value (bp) is pure noise: t-stat 0.48, p-value 0.64 — indistinguishable from random.
Sector Momentum Decomposition
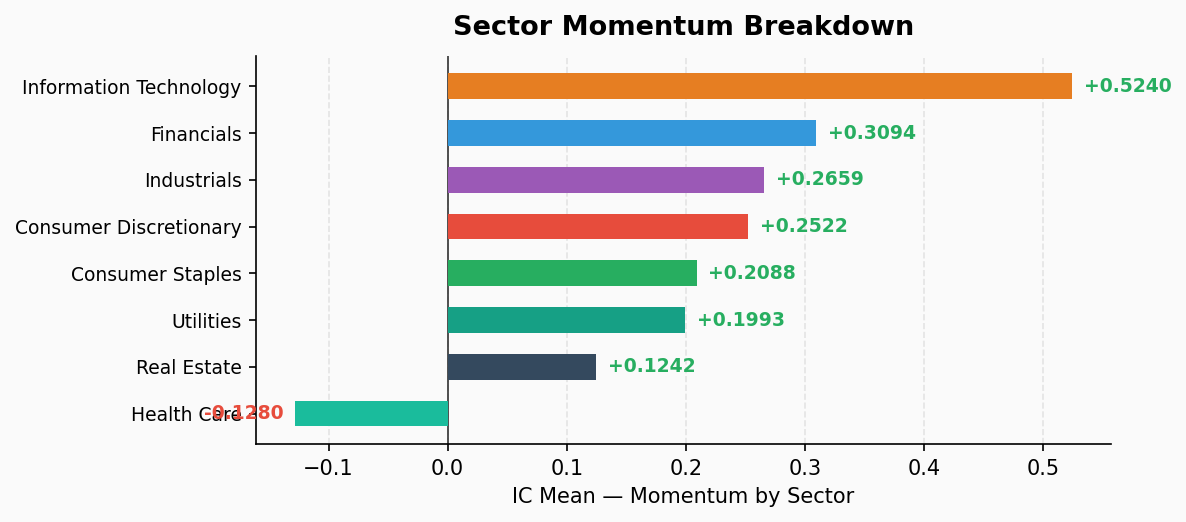
Breaking momentum factor down by GICS sector reveals where the effect is strongest:
| Sector | IC Mean | ICIR | IC+% | Q5 Monthly | Monotone |
|---|---|---|---|---|---|
| Info Tech | +0.524 | 2.584 | 100% | +27.19% | ⭐ Yes |
| Financials | +0.309 | 2.626 | 100% | +7.80% | — |
| Industrials | +0.266 | 2.878 | 100% | +5.51% | ⭐ Yes |
| Consumer Disc | +0.252 | 2.110 | 100% | +2.15% | ⭐ Yes |
| Consumer Staples | +0.209 | 1.341 | 87.2% | +0.02% | — |
| Utilities | +0.199 | 1.007 | 76.9% | -1.66% | — |
| Real Estate | +0.124 | 0.840 | 74.4% | +4.95% | — |
| Health Care | -0.128 | -1.206 | 15.4% | -2.66% | Inverse |
Sector Structure:
- Tech momentum is extreme: IC 0.524 — 2.3x the market-wide value. Q5 (highest momentum) averages +27.19%/month vs Q1 at -1.35%, a 28.5pp spread. The winner-take-all dynamic within tech is historically intense.
- Financials, Industrials, Consumer Discretionary show perfect monotonicity — momentum works cleanly here too.
- Health Care is the sole inverse: Negative IC (-0.128) means past winners become losers. This reflects the sector’s defensive nature and policy uncertainty driving mean reversion within healthcare names.
- Three sectors skipped: Communication Services (23 stocks), Energy (21), Materials (26) — insufficient sample size.
Style Summary
The market is in an extreme momentum-driven regime. Intra-tech dispersion has reached historic levels — top momentum names continue absorbing capital. Value factors are collectively inverted, confirming that “cheap” stocks remain cheap because the market is actively selling them.
This structure historically appears in late-cycle bull markets. Momentum profits handsomely while trends persist, but crowding risk means the reversal, when it comes, will be brutal — particularly in tech where crowding is most concentrated.
Key Risk: Q5 tech stocks averaging +27%/month is unsustainable. Any crack in the AI narrative will hit crowded momentum names first.