Factor Lab Daily Brief 2026-06-28
Momentum factor ICIR 2.70 continues to dominate; value factors underperform across the board; healthcare shows contrarian signal
📊 Cross-Market Factor IC Test
Backtest Period: 39 weeks | Universe: S&P 500 constituents | Data: Daily TTM financial panels
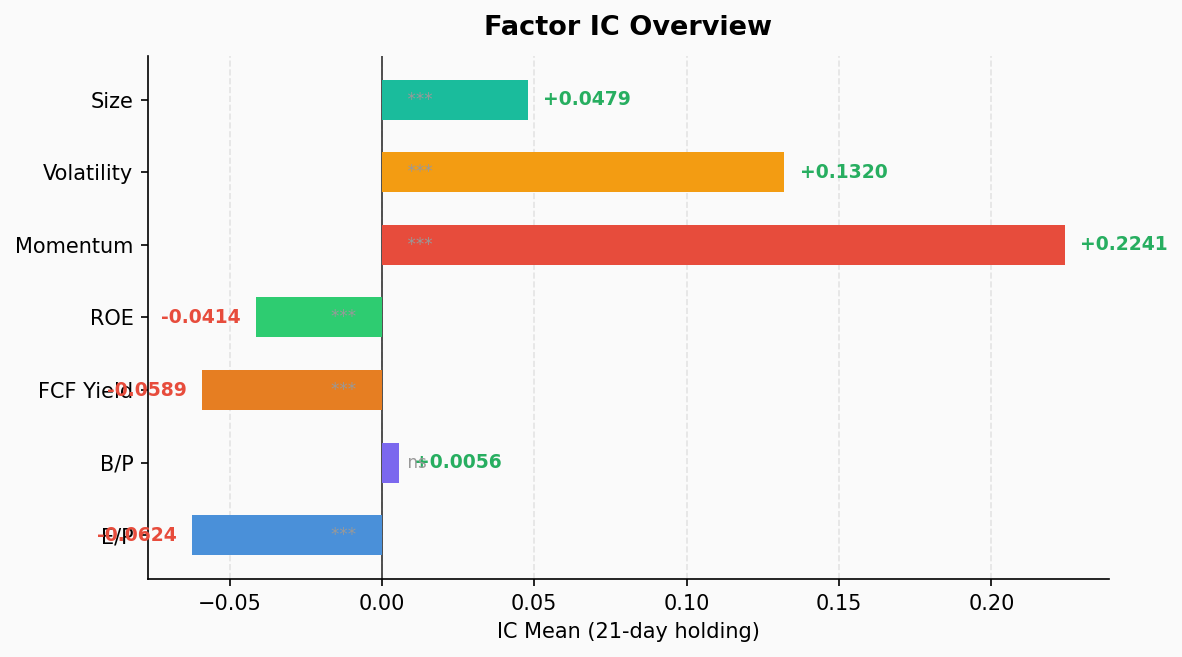
| Factor | IC Mean | ICIR | IC>0 % | t-stat | p-value | Q1 Mean Ret | Q5 Mean Ret | Long-Short |
|---|---|---|---|---|---|---|---|---|
| Momentum (mom) | +0.224 | 2.70 | 100% | 16.62 | 0.000 | -0.12% | +7.95% | -8.07% |
| Volatility (vol) | +0.132 | 1.05 | 79.5% | 6.48 | 0.000 | +0.54% | +8.15% | -7.61% |
| Market Cap (size) | +0.048 | 1.25 | 87.2% | 7.70 | 0.000 | +2.45% | +4.51% | -2.06% |
| Earnings Yield (ep) | -0.062 | -0.74 | 17.9% | -4.57 | 0.000 | +6.41% | +2.54% | +3.87% |
| FCF Yield (fcf) | -0.059 | -1.43 | 7.7% | -8.79 | 0.000 | +5.64% | +2.60% | +3.04% |
| ROE | -0.041 | -1.23 | 12.8% | -7.58 | 0.000 | +4.82% | +3.71% | +1.11% |
| Book/Price (bp) | +0.006 | 0.08 | 46.2% | 0.48 | 0.635 | +3.88% | +3.06% | +0.82% |
Note: Q1 = lowest factor quintile, Q5 = highest. Long-short = Q1 - Q5
Key Findings
1. Momentum Factor: Absolute Dominance
- ICIR 2.70 with 100% positive IC over 39 weeks — every rebalance in the past year
- Q5 (strongest momentum) averages +7.95%/week vs Q1 (weakest) at -0.12%
- Long-short spread of -8.07% — shorting losers has been extraordinarily profitable
2. High Volatility = High Returns (Extreme Risk-On)
- Volatility factor ICIR 1.05 — high-vol stocks systematically outperform low-vol
- Q5 (highest vol) +8.15% vs Q1 (lowest vol) +0.54%
- Classic risk-on signal: market is rewarding speculative behavior
3. Value Factors: Completely Dead
- FCF Yield: ICIR -1.43 — high-FCF stocks systematically underperform (growth > value)
- EP: ICIR -0.74 — high earnings yield stocks actually perform worse
- BP: Near zero (ICIR 0.08, p=0.64) — book value is irrelevant for stock selection
- Market is ignoring valuation entirely, driven purely by momentum and narrative
4. Size Factor: Large-Cap Preference
- ICIR 1.25 — large-cap stocks systematically outperform small-cap
- Q5 (largest market cap) +4.51% vs Q1 (smallest) +2.45%
- Capital concentration toward头部, possibly driven by AI megacap gravity
🏭 Sector Momentum Decomposition
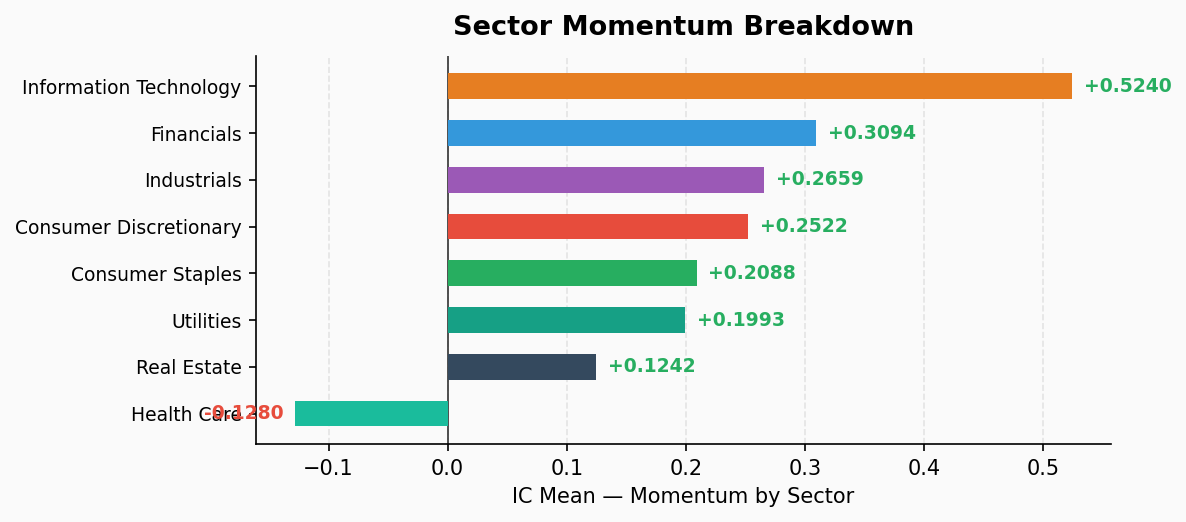
Momentum IC by sector — same factor tested within each GICS sector
| Sector | IC Mean | ICIR | IC>0 % | Q1 Ret | Q5 Ret | Long-Short | Verdict |
|---|---|---|---|---|---|---|---|
| Info Tech | +0.524 | 2.58 | 100% | -1.35% | +27.19% | -28.54% | 🔥 Extreme |
| Industrials | +0.266 | 2.88 | 100% | -1.63% | +5.51% | -7.14% | 🔥 Extreme |
| Financials | +0.309 | 2.63 | 100% | +0.61% | +7.80% | -7.19% | 🔥 Extreme |
| Consumer Disc. | +0.252 | 2.11 | 100% | -4.05% | +2.15% | -6.21% | 🟢 Strong |
| Consumer Staples | +0.209 | 1.34 | 87.2% | -4.65% | +0.02% | -4.67% | 🟡 Moderate |
| Utilities | +0.199 | 1.01 | 76.9% | -2.29% | -1.66% | -0.63% | 🟡 Moderate |
| Real Estate | +0.124 | 0.84 | 74.4% | +1.12% | +4.95% | -3.83% | 🟡 Moderate |
| Health Care | -0.128 | -1.21 | 15.4% | +4.84% | -2.66% | +7.51% | ⚠️ Reversal |
Sector Insights
1. IT: Momentum Returns are Extreme
- Q5 group averages +27.19% per period, long-short spread -28.54%
- Momentum strategy never failed in IT sector over 39 weeks (100% positive IC)
- AI/semiconductor leaders continue to vacuum capital — winner-take-all at its peak
2. Healthcare: The Only Reversal Signal ⚠️
- ICIR -1.21 — the only sector where momentum runs in reverse
- Cold healthcare stocks (Q1) actually surged +4.84%
- Possible explanation: value rotation after oversold + defensive appeal attracting flows
3. Industrials/Financials: Robust Momentum
- Both sectors with ICIR >2.5 and 100% positive IC
- Benefiting from infrastructure investment expectations and rate environment
📋 Summary
Current Market Regime:
- Pure Momentum Drive — Fundamental factors (EP, BP, FCF, ROE) collectively failing; market ignores valuation, follows trend only
- Extreme Risk-On — High-vol stocks outperform low-vol; speculation is being rewarded
- Top-Heavy — Large-cap preference; capital concentrating in IT/Financials/Industrials leaders
- Healthcare Reversal — Only contrarian sector showing mean-reversion; potential rotation signal
Strategy Implications:
- Trend-following remains effective, but watch for momentum crash risk (FNG now in Extreme Fear)
- Healthcare reversal signal worth monitoring — may be early indicator of defensive rotation
- When value factors collectively fail, it often signals a structural market shift is underway