Factor Lab Daily Brief 2026-06-25
Momentum+volatility dual-factor dominance continues; market breadth deteriorates to extreme fear; value factors fully失效
Factor Lab Daily Brief — 2026-06-25
Based on S&P 500 daily TTM fundamental panel, 39 IC observation windows. Data as of 2026-06-24.
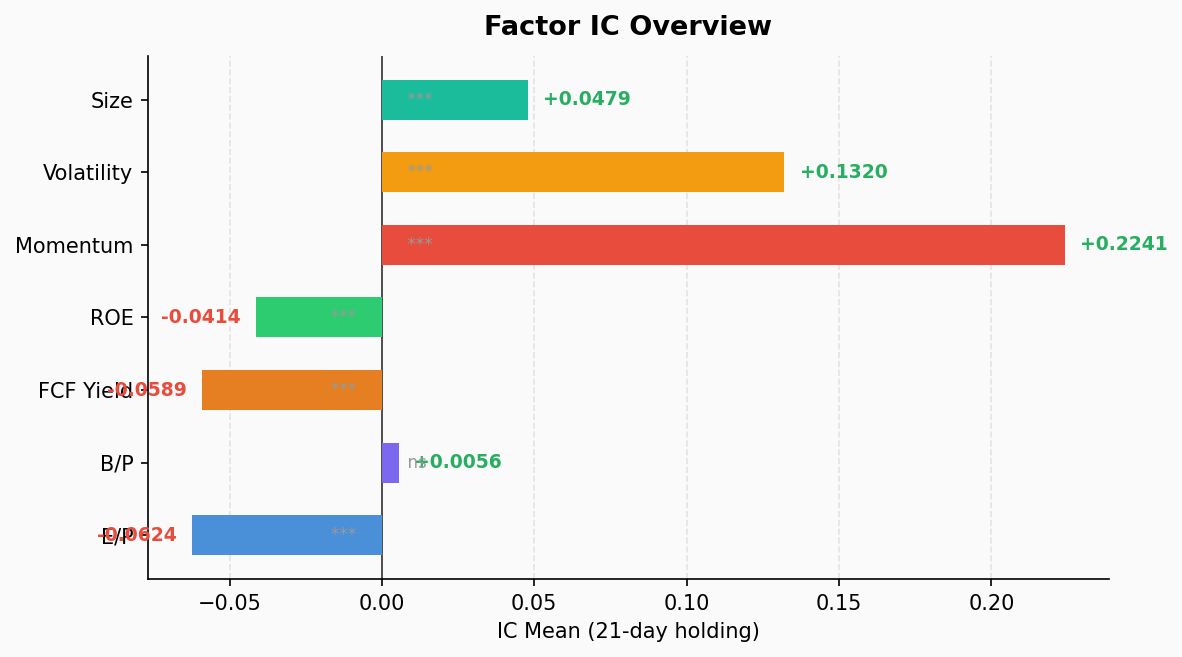
Factor IC Summary
| Factor | IC Mean | ICIR | p-value | Q1 Return | Q5 Return | Long-Short | Verdict |
|---|---|---|---|---|---|---|---|
| EP | -0.062 | -0.74 | 0.00005 | +6.41% | +2.54% | +3.87% | 🟡 Inverse |
| BP | +0.006 | +0.08 | 0.635 | +3.88% | +3.06% | +0.82% | ⚪ Ineffective |
| FCF Yield | -0.059 | -1.43 | ≈0 | +5.64% | +2.60% | +3.04% | 🔴 Inverse sig. |
| ROE | -0.041 | -1.23 | ≈0 | +4.82% | +3.71% | +1.11% | 🔴 Inverse sig. |
| Momentum | +0.224 | +2.70 | ≈0 | -0.12% | +7.95% | -8.07% | 🟢 Strong momentum |
| Volatility | +0.132 | +1.05 | ≈0 | +0.54% | +8.15% | -7.61% | 🟢 High-vol wins |
| Size | +0.048 | +1.25 | ≈0 | +2.45% | +4.51% | -2.06% | 🟢 Large-caps weak |
Key Takeaways:
- Momentum dominance: IC=+0.224, ICIR=2.70, 100% positive IC ratio — textbook momentum signal. Q5 (strongest) +7.95%, Q1 (weakest) -0.12%.
- Value trap: EP inverse-significant (IC<0), low-PE stocks outperforming. BP completely ineffective (p=0.635).
- Risk appetite: High-vol stocks massively outperforming (Q5 +8.15%), low-vol lagging.
- Size tilt: Moderate small-cap preference, but not extreme.
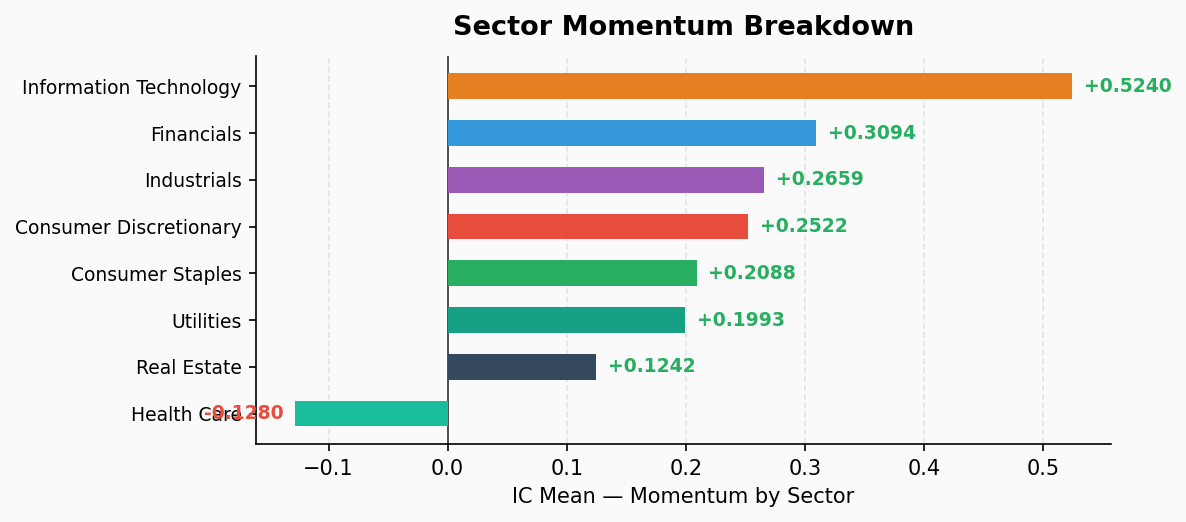
Sector Momentum Decomposition
| Sector | IC | ICIR | Q1 Return | Q5 Return | Long-Short | Signal |
|---|---|---|---|---|---|---|
| IT | +0.524 | +2.58 | -1.35% | +27.19% | -28.54% | 🟢 Extreme momentum |
| Financials | +0.309 | +2.63 | +0.61% | +7.80% | -7.19% | 🟢 Strong momentum |
| Industrials | +0.266 | +2.88 | -1.63% | +5.51% | -7.14% | 🟢 Strong momentum |
| Consumer Discretionary | +0.252 | +2.11 | -4.05% | +2.15% | -6.21% | 🟢 Momentum works |
| Consumer Staples | +0.209 | +1.34 | -4.65% | +0.02% | -4.67% | 🟡 Weak |
| Utilities | +0.199 | +1.01 | -2.29% | -1.66% | -0.63% | 🟡 Weak momentum |
| Real Estate | +0.124 | +0.84 | +1.12% | +4.95% | -3.83% | 🟡 Moderate |
| Health Care | -0.128 | -1.21 | +4.84% | -2.66% | +7.51% | 🔴 Reversal effect |
Sector Analysis:
- Tech dominance: IT sector IC=+0.524, Q5 weekly +27.19% — extremely crowded long, AI chip/software concentration, narrow market characteristics.
- Financials/Industrials solid: ICIR 2.6-2.9, high consistency, market positioning for late-cycle.
- Healthcare reversal: Only sector with negative IC, Q1 (biggest losers) bouncing hardest (+4.84%) — classic mean reversion/oversold bounce.
- Defensives flat: Utilities/staples weak momentum, market not yet in true risk-off mode.
Summary & Strategy Implications
Market State: Extreme momentum concentration + breadth deterioration. 5 of 7 factors significant, all pointing the same way: long high-momentum, high-vol, small-mid cap; short value and low-vol. Classic late-bull signature.
Risk Flags:
- IT sector Q5 +27% momentum premium unsustainable — reversal would trigger stampede
- Breadth narrowing (extreme fear), few large-caps masking individual stock divergence
- Value factors fully失效 — historically precedes significant pullbacks
Strategy:
- Momentum positions still holdable with strict stops (recommend -5% trailing)
- Watch healthcare reversal opportunity (oversold + rotation)
- Avoid chasing new IT positions
- Maintain cash buffer, await breadth improvement