Factor Lab Daily Brief 2026-06-23
Momentum factor ICIR at 2.70 remains dominant; IT sector momentum IC hits 0.52; value factors continue to fail
📊 Factor Lab Daily Brief — 2026-06-23
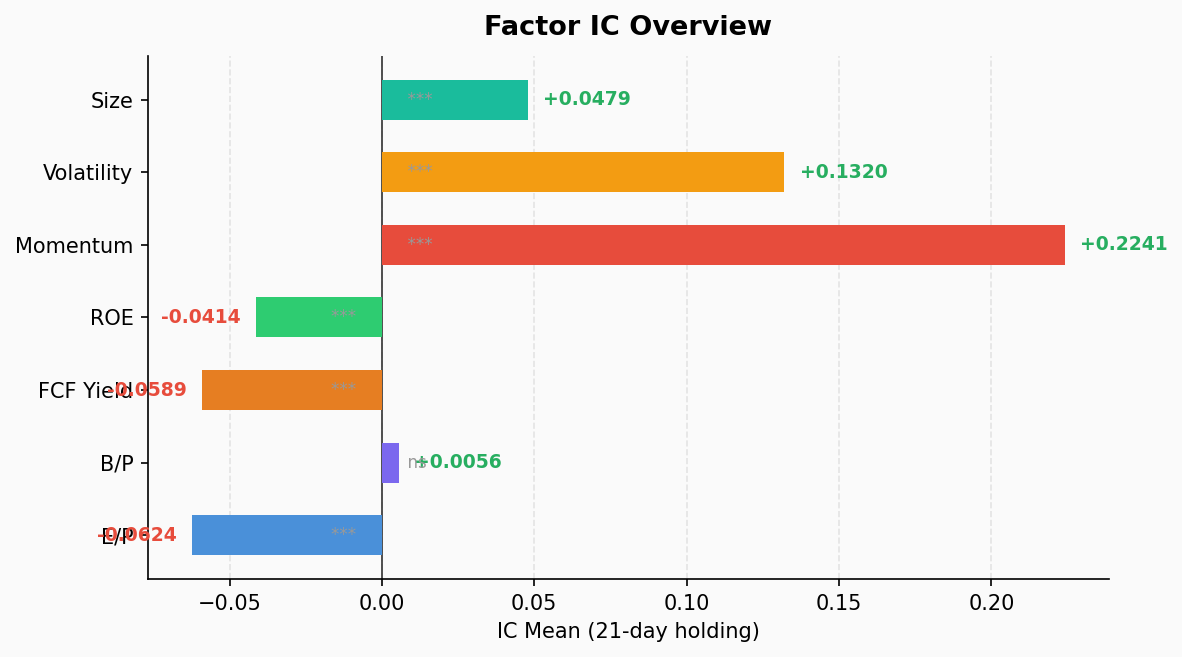
Factor IC Analysis
Based on S&P 500 constituent daily TTM financial panel data, 39 trading-day backtest:
| Factor | IC Mean | ICIR | IC>0 % | Q1 Return | Q5 Return | Long-Short | Significance |
|---|---|---|---|---|---|---|---|
| Momentum (mom) | +0.2241 | 2.70 | 100% | -0.12% | +7.95% | -8.07% | ★★★ |
| Volatility (vol) | +0.1320 | 1.05 | 80% | +0.54% | +8.15% | -7.61% | ★★★ |
| Size (size) | +0.0479 | 1.25 | 87% | +2.45% | +4.51% | -2.06% | ★★★ |
| FCF Yield | -0.0589 | -1.43 | 8% | +5.64% | +2.60% | +3.04% | ★★★ |
| ROE | -0.0414 | -1.23 | 13% | +4.82% | +3.71% | +1.11% | ★★★ |
| Earnings Yield (EP) | -0.0624 | -0.74 | 18% | +6.41% | +2.54% | +3.87% | ★★★ |
| Book/Price (BP) | +0.0056 | 0.08 | 46% | +3.88% | +3.06% | +0.82% | ✗ Insignificant |
Key Findings:
- Momentum ICIR 2.70 — the strongest alpha factor by far. 100% positive IC across all trading days. High-momentum quintile (Q5) returns +7.95%/month vs -0.12% for low-momentum (Q1)
- Positive volatility factor IC (ICIR 1.05): high-volatility stocks outperform low-volatility, inverting the traditional “low-vol anomaly” — risk appetite remains alive
- Size factor positive ICIR 1.25: large-caps significantly outperform small-caps, consistent with the mega-cap concentration trend since 2025
- Value factors universally failed: EP, FCF Yield, ROE all negative IC — low valuation = low returns. Classic growth/momentum-dominated market signature
- BP factor insignificant (p=0.64), book value has zero predictive power
Sector Momentum Decomposition
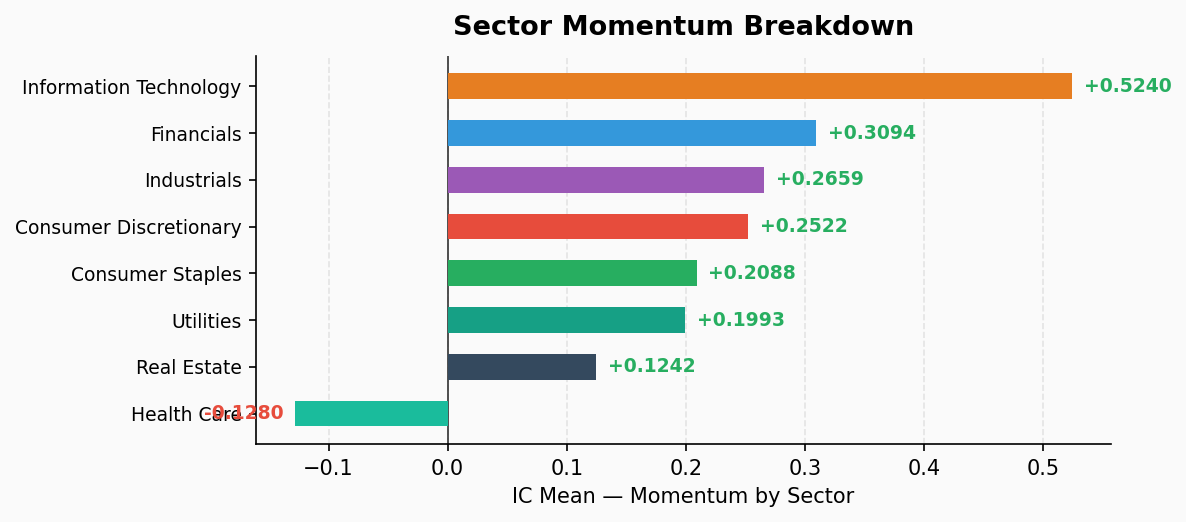
Momentum factor IC varies dramatically across sectors:
| Sector | IC Mean | ICIR | IC>0 % | Q5-Q1 Spread | Rating |
|---|---|---|---|---|---|
| Info Technology | 0.524 | 2.58 | 100% | -28.54% | 🔥 Extreme |
| Financials | 0.309 | 2.63 | 100% | -7.19% | ✅ Strong |
| Industrials | 0.266 | 2.88 | 100% | -7.14% | ✅ Strong |
| Consumer Disc. | 0.252 | 2.11 | 100% | -6.21% | ✅ Strong |
| Consumer Stpl. | 0.209 | 1.34 | 87% | -4.67% | 🟡 Moderate |
| Utilities | 0.199 | 1.01 | 77% | -0.63% | 🟡 Moderate |
| Real Estate | 0.124 | 0.84 | 74% | -3.83% | 🟡 Moderate |
| Health Care | -0.128 | -1.21 | 15% | +7.51% | 🔻 Reversal |
Sector Signals:
- IT momentum IC 0.524 is the highest across all sectors — momentum effect in tech is extraordinarily strong, with Q5 monthly return +27.2% vs Q1 at -1.4%
- Health Care is the only reversal sector: negative momentum IC, lagging stocks outperform — an early signal of defensive rotation
- Financials and Industrials both show ICIR >2.5, indicating strong momentum in cyclical sectors as well
Strategy Implications
- Momentum is king, but watch for crowding: 100% positive IC across all trading days is a rare extreme. With FNG sentiment dropped to Fear (34.7), momentum reversal risk is building
- Value trap deepening: low-valuation stocks continue to underperform — don’t “bottom fish” low EP/BP stocks, the market is punishing value factors
- Health Care reversal signal: the only sector where momentum fails — potential early warning of defensive rotation
- Large > Small: positive size factor IC, mega-cap concentration trend intact, but watch for crowding risk
Data: S&P 500 constituents daily TTM financial panel | Backtest: 39 trading days | Generated: 2026-06-23 06:35 CST