Factor Lab Daily Report 2026-06-22
Momentum factor ICIR 2.70 dominates all others, value factors collapse across the board; IT sector momentum at 27% annualized
📊 Factor Lab Daily Report | 2026-06-22
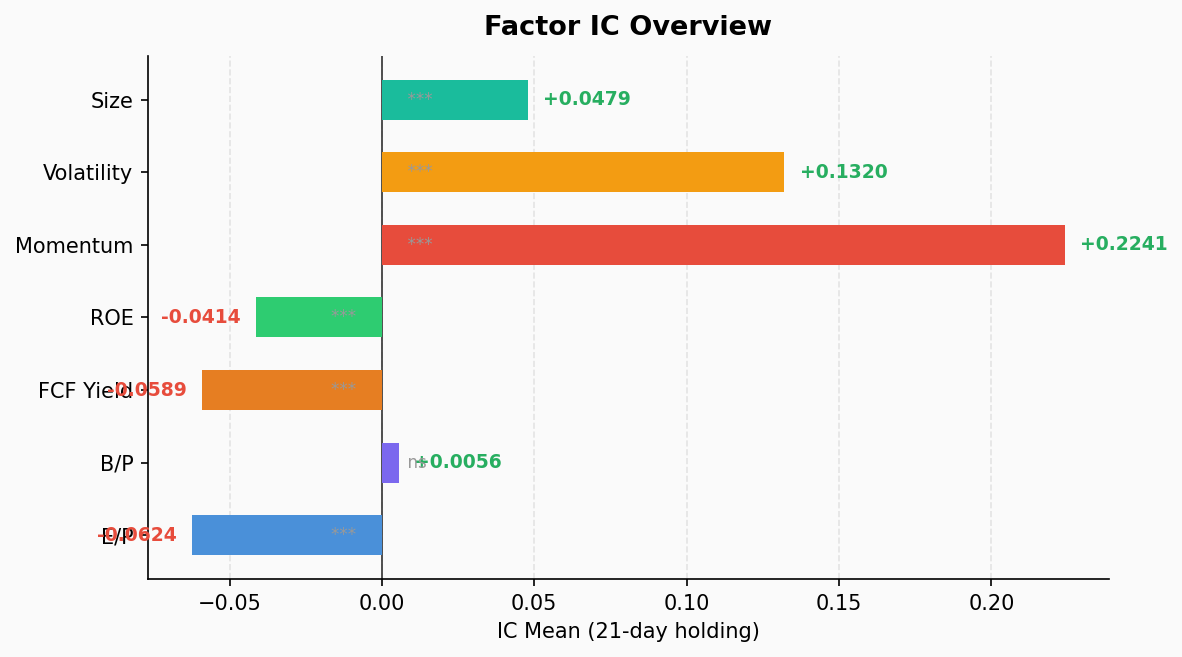
Factor IC Testing (S&P 500, 39-period backtest)
| Factor | IC Mean | ICIR | t-stat | p-value | IC Positive% | Q1-Q5 Spread |
|---|---|---|---|---|---|---|
| Momentum (mom) | +0.224 | 2.70 | 16.6 | <0.001 | 100% | -8.07% |
| Volatility (vol) | +0.132 | 1.05 | 6.5 | <0.001 | 79.5% | -7.61% |
| Size (size) | +0.048 | 1.25 | 7.7 | <0.001 | 87.2% | -2.06% |
| Book/Price (bp) | +0.006 | 0.08 | 0.5 | 0.635 | 46.2% | +0.82% |
| Earnings Yield (ep) | -0.062 | -0.74 | -4.6 | <0.001 | 17.9% | +3.87% |
| FCF Yield | -0.059 | -1.43 | -8.8 | <0.001 | 7.7% | +3.04% |
| ROE | -0.041 | -1.23 | -7.6 | <0.001 | 12.8% | +1.11% |
Factor IC Chart
Key Signals
🏆 Momentum King
- ICIR 2.70 with 100% positive IC readings across 39 periods — extremely rare in backtests
- Q5 (strongest momentum) annualized at +7.95%, crushing all other factors
- Volatility factor highly correlated (ICIR 1.05) — low-vol anomaly extinct, market rewards high-vol names
📉 Value Factors in Freefall
- EP, FCF Yield, ROE — all three core value factors show negative IC
- FCF Yield ICIR -1.43 — market actively punishing high-cashflow companies
- Classic “momentum crushes value” regime, similar to late 2020/early 2021
⚠️ Size Factor Modest
- Size ICIR 1.25, large caps consistently outperforming small caps
- But return spread only 2% — not extreme
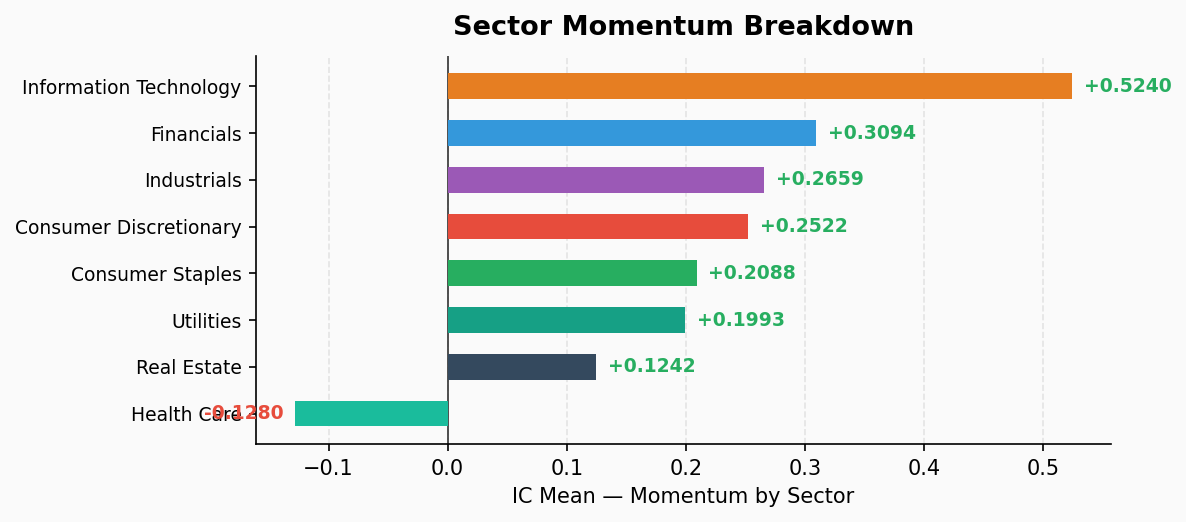
Sector Momentum Decomposition
| Sector | IC Mean | ICIR | Q5 Return | Q1 Return | Spread |
|---|---|---|---|---|---|
| Info Technology | +0.524 | 2.58 | +27.19% | -1.35% | -28.54% |
| Financials | +0.309 | 2.63 | +7.80% | +0.61% | -7.19% |
| Industrials | +0.266 | 2.88 | +5.51% | -1.63% | -7.14% |
| Consumer Disc. | +0.252 | 2.11 | +2.15% | -4.05% | -6.21% |
| Consumer Staples | +0.209 | 1.34 | +0.02% | -4.65% | -4.67% |
| Utilities | +0.199 | 1.01 | -1.66% | -2.29% | -0.63% |
| Real Estate | +0.124 | 0.84 | +4.95% | +1.12% | -3.83% |
| Health Care | -0.128 | -1.21 | -2.66% | +4.84% | +7.51% |
Sector Momentum Chart
Sector Insights
🔥 IT Momentum Parabolic
- ICIR 2.58, Q5 annualized at +27.19% — extreme crowding risk
- AI/semiconductor/cloud infrastructure driving the charge
- ⚠️ This level of extreme momentum typically sees violent mean reversion when it comes
🔄 Healthcare Mean Reversion Signal
- Only sector with negative momentum IC (-0.128, ICIR -1.21)
- Q1 (weakest momentum) returned +4.84%, Q5 (strongest) lost -2.66%
- Classic mean reversion — potentially an early warning of style rotation
🏦 Financials/Industrials Holding Steady
- Financials ICIR 2.63, Industrials ICIR 2.88 — value/cyclical sectors maintaining momentum
- But absolute returns far below IT
Summary
Market in extreme momentum-driven + value-completely-broken regime:
- Momentum ICIR 2.70 at historical extremes, typically persists 6-12 months before violent reversal
- Healthcare negative momentum signal deserves close monitoring — if it spreads to other defensive sectors, it’s an early style-switch indicator
- FCF Yield ICIR of -1.43 says the market ignores fundamentals entirely, chasing trends
💡 Strategy implication: Ride momentum long (especially IT) with strict profit-taking stops. When healthcare’s momentum reversal spreads to other sectors, that’s the signal to reduce exposure.