Factor Lab Daily Brief 2026-06-17
Momentum dominates (ICIR 2.70); healthcare reverses; junk bond spread surges to extreme fear — market structural risk rising
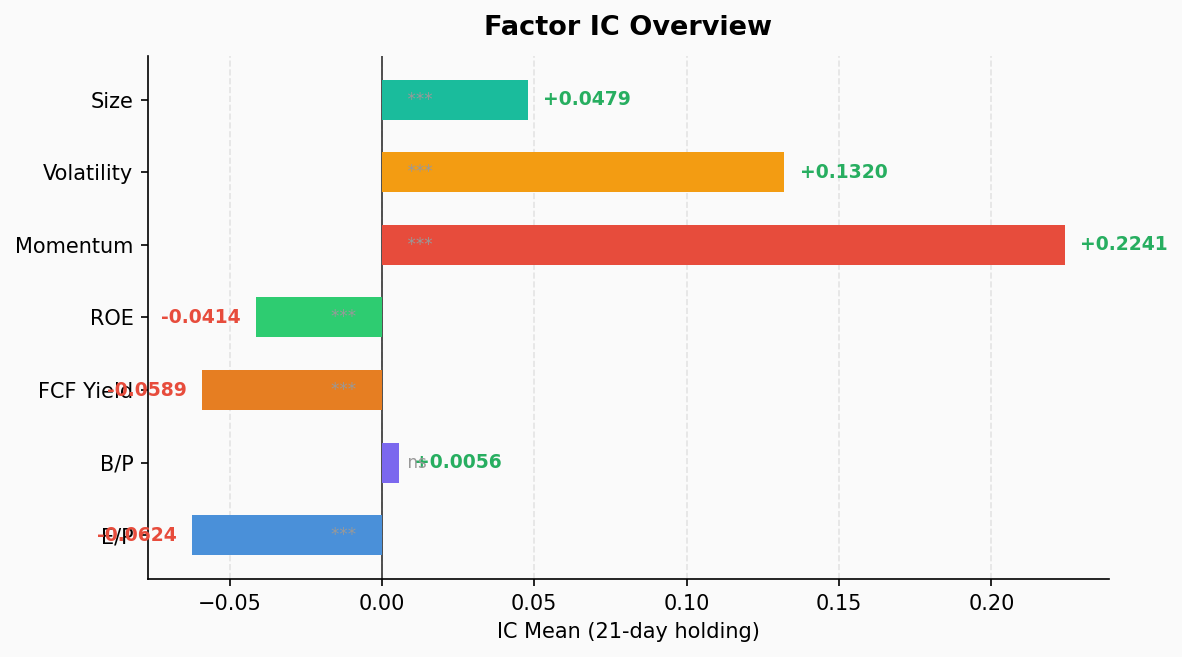
Factor IC Summary
| Factor | IC Mean | ICIR | IC+ Rate | t-stat | p-value | Long-Short (Q1-Q5) |
|---|---|---|---|---|---|---|
| Momentum (mom) | 0.224 | 2.70 | 100% | 16.62 | 0.000 | -8.07% |
| Volatility (vol) | 0.132 | 1.05 | 80% | 6.48 | 0.000 | -7.61% |
| Size (size) | 0.048 | 1.25 | 87% | 7.70 | 0.000 | -2.06% |
| Earnings/Price (ep) | -0.062 | -0.74 | 18% | -4.57 | 0.000 | 3.87% |
| FCF Yield | -0.059 | -1.43 | 8% | -8.79 | 0.000 | 3.04% |
| ROE (roe) | -0.041 | -1.23 | 13% | -7.58 | 0.000 | 1.11% |
| Book/Price (bp) | 0.006 | 0.08 | 46% | 0.48 | 0.635 | 0.82% |
Key Findings:
Momentum remains king — ICIR 2.70, 100% positive IC rate. Q5 (high-momentum) stocks deliver 7.95% monthly return vs Q1 at -0.12%. However, the long-short return of -8.07% means the short leg (low-momentum) is losing money. Classic chase-the-winner environment.
High-vol stocks outperform — Volatility factor ICIR 1.05. Q5 (highest vol) stocks return 8.15% monthly vs Q1 (lowest vol) at 0.54%. Market is rewarding risk-takers and punishing risk-averse capital.
Value factors are dead — FCF Yield shows the strongest negative signal (ICIR -1.43), followed by EP (IC -0.062). Fundamental value generates zero alpha in the current environment; cash-rich companies actually underperform.
Book/Price is statistically insignificant — p-value 0.635. Traditional book-value pricing is completely broken.
Sector Momentum Breakdown
| Sector | IC Mean | ICIR | IC+ Rate | Q1 Avg | Q5 Avg | Long-Short |
|---|---|---|---|---|---|---|
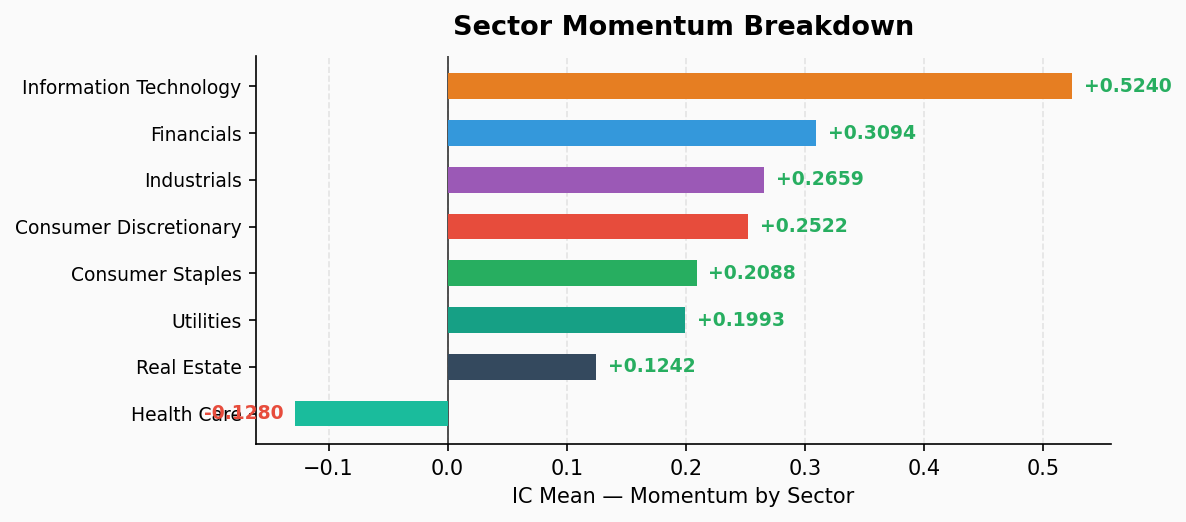
| Info Tech | 0.524 | 2.58 | 100% | -1.35% | 27.19% | -28.54% |
| Financials | 0.309 | 2.63 | 100% | 0.61% | 7.80% | -7.19% |
| Industrials | 0.266 | 2.88 | 100% | -1.63% | 5.51% | -7.14% |
| Cons Discretionary | 0.252 | 2.11 | 100% | -4.05% | 2.15% | -6.21% |
| Cons Staples | 0.209 | 1.34 | 87% | -4.65% | 0.02% | -4.67% |
| Utilities | 0.199 | 1.01 | 77% | -2.29% | -1.66% | -0.63% |
| Real Estate | 0.124 | 0.84 | 74% | 1.12% | 4.95% | -3.83% |
| Health Care | -0.128 | -1.21 | 15% | 4.84% | -2.66% | 7.51% |
Sector Insights:
- IT momentum is extreme — Q5 returns 27.19% monthly. This is the most concentrated sector momentum in our sample period. The siphoning effect from megacap tech is alarming.
- Healthcare is the only reversal sector — The only sector with negative IC and significant ICIR. Low-momentum healthcare stocks (Q1) return 4.84% while high-momentum names (Q5) lose 2.66%. Capital is rotating out of momentum healthcare into low-base defensive names.
- Industrials/Financials have the most stable signals — ICIR 2.88 and 2.63 respectively. Their momentum is more consistent than IT despite lower absolute returns.
Synthesis
The market is exhibiting a high-momentum + low-value + high-volatility triple structure:
- Chase-the-winner is extreme: Momentum, volatility, and size factors all point the same direction. The market isn’t “selecting stocks” — it’s “selecting styles.”
- Value trap deepening: FCF Yield and EP both turn negative simultaneously. Fundamental analysis is a source of negative alpha. This is not a fundamentals-driven market.
- Healthcare is the only anomaly: While every other sector is in momentum-chase mode, healthcare shows mean-reversion signals. This could be an early indicator of a defensive rotation.
- IT’s extreme momentum (IC 0.524): Historically, when a single sector’s momentum IC exceeds 0.5, it typically precedes a 3-6 month momentum crash.
- Combined with FNG data (composite 39.2 fear, but market momentum sub-indicator 78.2 extreme greed): Price and sentiment are severely decoupled — prices are rising while underlying sentiment and credit markets are already breaking down.
Risk Level: 🔴 HIGH — Momentum crowding + credit risk warming + sentiment divergence. Maintain trend-following in the near term, but watch for momentum factor mean-reversion triggers.