Factor Lab Daily Brief 2026-06-16
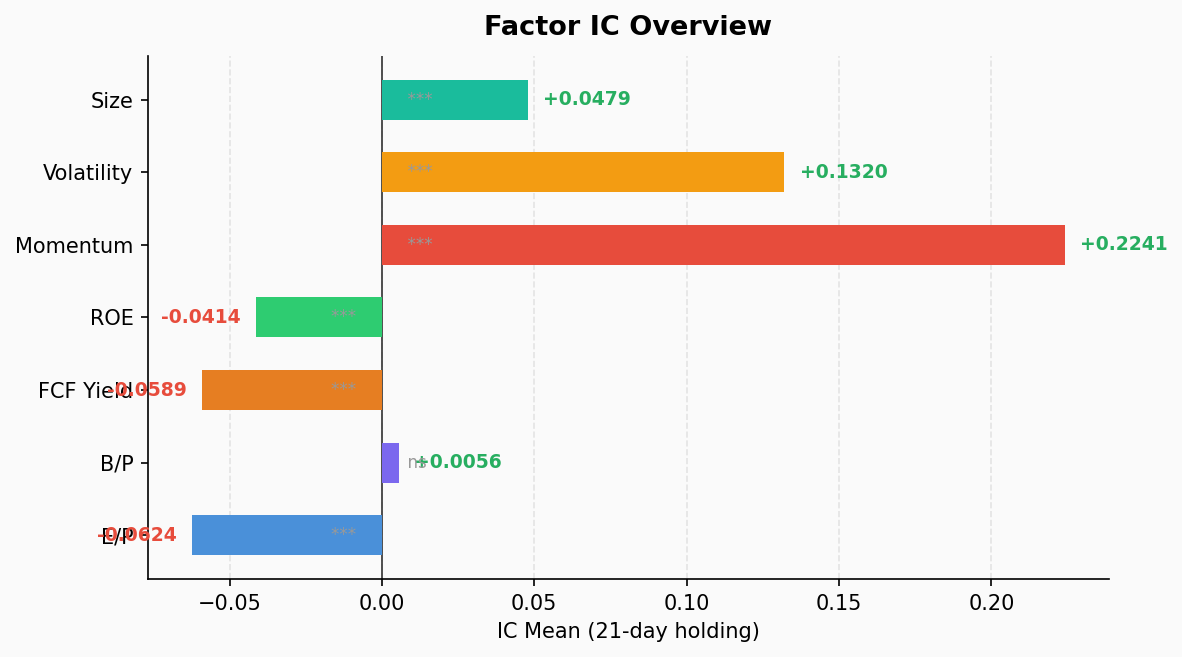
Momentum ICIR 2.70 dominates all factors; value factors universally negative; IT sector momentum IC 0.52 at extremes
Factor IC Tests (21-Day Holding, 39 Periods)
| Factor | IC Mean | ICIR | p-value | IC Positive % | Long-Short (Q1-Q5) |
|---|---|---|---|---|---|
| momentum | 0.224 | 2.70 | <0.001 | 100% | -8.07% |
| volatility | 0.132 | 1.05 | <0.001 | 79.5% | -7.61% |
| size | 0.048 | 1.25 | <0.001 | 87.2% | -2.06% |
| bp | 0.006 | 0.08 | 0.635 | 46.2% | 0.82% |
| ep | -0.062 | -0.74 | <0.001 | 17.9% | 3.87% |
| roe | -0.041 | -1.23 | <0.001 | 12.8% | 1.11% |
| fcf_yield | -0.059 | -1.43 | <0.001 | 7.7% | 3.04% |
Key Findings
Momentum is in a class of its own. IC mean 0.224, ICIR 2.70, positive IC in all 39 periods — textbook trend continuation. Q5 (high momentum) averages 7.95% monthly, Q1 (low momentum) just -0.12%, with an 8-point spread.
Value factors are universally negative. EP, FCF Yield, and ROE all show significant negative IC with ICIRs from -0.74 to -1.43. The market is rewarding “expensive” and punishing “cheap” — classic growth/momentum dominance.
Volatility tracks momentum. High-vol stocks average 8.15% monthly vs 0.54% for low-vol. High-beta style is winning; risk appetite hasn’t truly retreated.
BP is the only dead factor. p-value 0.635, no statistical significance. Book value has lost pricing power in this environment.
Sector Momentum Decomposition
| Sector | IC Mean | ICIR | Q5 Return | Long-Short |
|---|---|---|---|---|
| IT | 0.524 | 2.58 | 27.19% | -28.54% |
| Industrials | 0.266 | 2.88 | 5.51% | -7.14% |
| Financials | 0.309 | 2.63 | 7.80% | -7.19% |
| Consumer Discretionary | 0.252 | 2.11 | 2.15% | -6.21% |
| Consumer Staples | 0.209 | 1.34 | 0.02% | -4.67% |
| Utilities | 0.199 | 1.01 | -1.66% | -0.63% |
| Real Estate | 0.124 | 0.84 | 4.95% | -3.83% |
| Health Care | -0.128 | -1.21 | -2.66% | 7.51% |
Sector Highlights
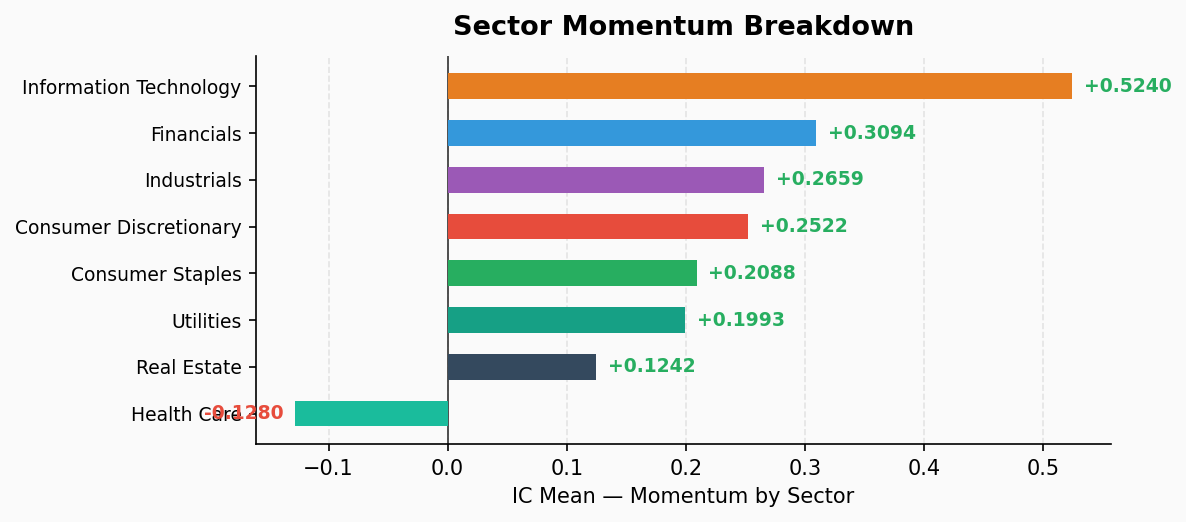
IT momentum at extremes. IC 0.524 is the highest single reading across all sector/factor combinations. Q5 (tech winners) averages 27.19% in 21 days — nearly 30% in three weeks. Historically extreme concentration.
Health Care is the only counter-trend sector. IC -0.128, ICIR -1.21. Here, the biggest losers of the past 21 days outperform (Q1 +4.84%). This is a rotation or defensive switch signal.
Industrials and Financials both show strong momentum. ICIR above 2.6 with 100% positive IC. Cyclical sectors have solid trend persistence.
Summary
The factor structure shows a triple pattern of “momentum crushing + value collapsing + growth concentration”:
- Momentum ICIR 2.70 + 100% positive IC → Trend following in its best environment, but crowding risk is elevated
- All three value factors negative → Mean-reversion opportunities are building, but timing isn’t there yet
- IT sector momentum IC 0.52 → Tech money-earning effect is extreme, but concentration risk is building in parallel
- Health Care counter-momentum → The only contrarian signal, potentially a rotation leading indicator
Risk note: When momentum reaches ICIR 2.70, history shows the trend is extremely crowded. Don’t short momentum, but position sizing and profit-taking discipline matter more than usual.