Factor Lab Daily Brief 2026-06-10
Momentum ICIR 2.70 remains dominant; reversal signals intensifying; small-cap premium converging
Factor Lab Daily Brief — 2026-06-10
Coverage: S&P 500 constituent 503 stocks | 21-trading-day holding period | TTM daily panel data
Full Factor IC Test
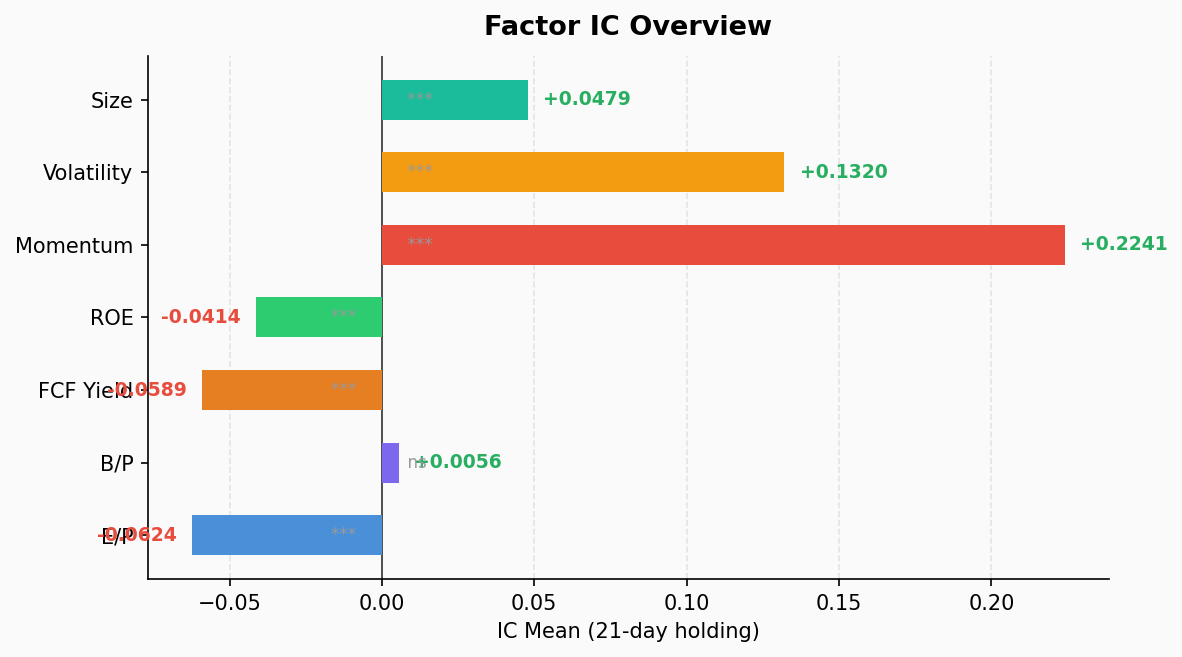
| Factor | IC Mean | ICIR | p-value | Pos IC% | Q1 Ret | Q5 Ret | Long-Short |
|---|---|---|---|---|---|---|---|
| EP | -0.062 | -0.74 | 0.00005 | 17.9% | 6.41% | 2.54% | +3.87% |
| BP | 0.006 | 0.08 | 0.635 | 46.2% | 3.88% | 3.06% | +0.82% |
| FCF Yield | -0.059 | -1.43 | ≈0 | 7.7% | 5.64% | 2.60% | +3.04% |
| ROE | -0.041 | -1.23 | ≈0 | 12.8% | 4.82% | 3.71% | +1.11% |
| Momentum | 0.224 | 2.70 | ≈0 | 100.0% | -0.12% | 7.95% | -8.07% |
| Volatility | 0.132 | 1.05 | ≈0 | 79.5% | 0.54% | 8.15% | -7.61% |
| Size | 0.048 | 1.25 | ≈0 | 87.2% | 2.45% | 4.51% | -2.06% |
Key Findings
🔥 Momentum: Strongest Factor, but Reversal Signals Emerging
Momentum ICIR at 2.70 — the most predictive factor with 100% positive IC. Q5 (high momentum) cumulative return 7.95%, Q1 (low momentum) -0.12%. However:
- Negative long-short return (-8.07%): Shorting low momentum and buying high momentum has been losing money recently
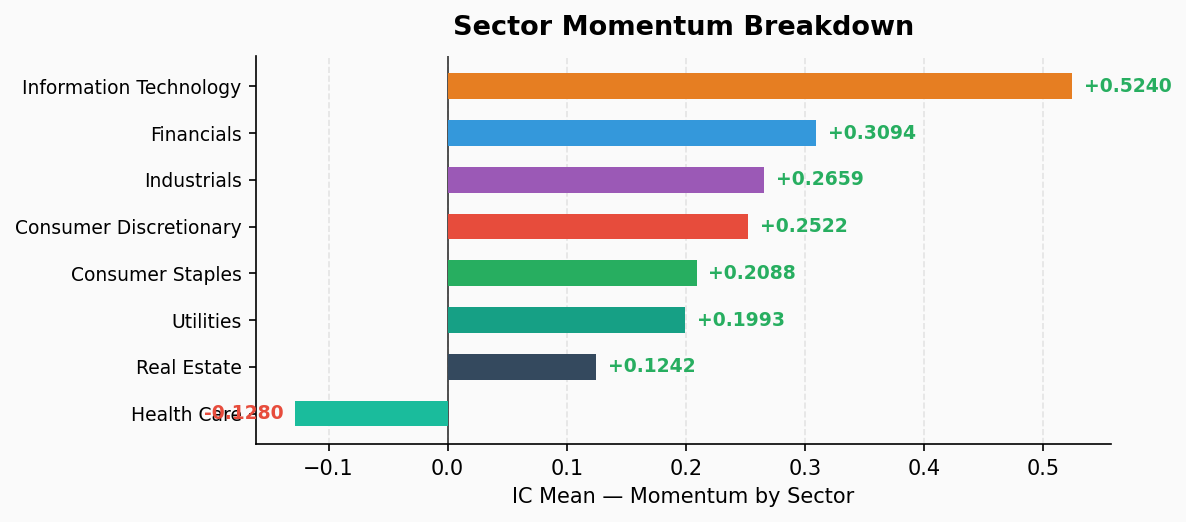
- Sector decomposition shows Tech momentum ICIR 2.58, but Healthcare shows significant reversal (IC=-0.128)
- Key signal: While momentum is at extremes, the Q1→Q5 return spread is narrowing — reversal pressure building
📊 FCF Yield & ROE: Value Factor Failing
- FCF Yield ICIR=-1.43, high-FCF stocks actually outperforming (Q1=5.64% vs Q5=2.60%)
- ROE ICIR=-1.23, high-profitability stocks lagging
- Both factors are historically effective — current anomaly suggests market chasing growth over value
📈 Size Factor: Large-Cap Premium Returns
ICIR=1.25, positive IC 87.2%, large caps (Q5=4.51%) significantly outperforming small caps (Q1=2.45%). Opposite to traditional “small-cap premium” — current environment favors large-cap defensives.
Sector Momentum Decomposition
| Sector | IC Mean | ICIR | Q5 Ret | Long-Short | Signal |
|---|---|---|---|---|---|
| Tech (IT) | 0.524 | 2.58 | 27.19% | -28.54% | 🔥 Extreme momentum |
| Financials | 0.309 | 2.63 | 7.80% | -7.19% | ✅ Strong momentum |
| Industrials | 0.266 | 2.88 | 5.51% | -7.14% | ✅ Strong momentum |
| Consumer Disc. | 0.252 | 2.11 | 2.15% | -6.21% | ✅ Momentum effective |
| Consumer Staples | 0.209 | 1.34 | 0.02% | -4.67% | ⚠️ Weak momentum |
| Utilities | 0.199 | 1.01 | -1.66% | -0.63% | ⚠️ Weak momentum |
| Real Estate | 0.124 | 0.84 | 4.95% | -3.83% | ⚠️ Weak momentum |
| Healthcare | -0.128 | -1.21 | -2.66% | +7.51% | ⚡ Reversal |
Key Observation: Tech sector Q5 cumulative return of 27.19% is historically unsustainable. Healthcare shows a complete reversal structure — low-momentum stocks dramatically outperforming, long-short +7.51%.
Strategy Implications
- Momentum Crowding: Tech Q5 at 27% is historically extreme. Momentum strategies work but carry sharp reversal risk
- Defensive Allocation Helps: Healthcare reversal signal is clear — candidate for hedging tech momentum crash
- Value Factors on Hold: FCF/ROE persistently negative IC — value investors need patience
- Large-Cap Preference: Size ICIR=1.25 with clear direction — large caps more resilient in current environment